Best Stock Market Research & Analysis Software for 2026

Beginners and expert stock traders agree that research and analysis are essential to finding the right stocks. The in-depth details can reveal a stock’s potential to increase in price or crash in the market. Fortunately, you can have the best stock market research & analysis software on your mobile device.
These applications provide insights to help you research stocks and their potential. They also provide graphical representations of crucial details like moving averages, trend lines, etc. With that in mind, let’s review the seven best stock analysis software programs for 2026.
-
- AltIndex – Best All-around Stock Market Research & Analysis Software
- SharemarketCap: Best for Technical Analysis
- Trade Ideas: Best for Real-time Day Traders
- Benzinga Pro: The Best News Platform for Stock Research
- TradingView: Best for Social Trading
- TrendSpider: The Best Stock Market Research & Analysis Software for Scenario Searches
- FinViz: The Best Stock Market Research & Analysis Software for Visualizations
-
-
- AltIndex – Best All-around Stock Market Research & Analysis Software
- SharemarketCap: Best for Technical Analysis
- Trade Ideas: Best for Real-time Day Traders
- Benzinga Pro: The Best News Platform for Stock Research
- TradingView: Best for Social Trading
- TrendSpider: The Best Stock Market Research & Analysis Software for Scenario Searches
- FinViz: The Best Stock Market Research & Analysis Software for Visualizations
-
The Best Stock Market Research & Analysis Software Ranked
Get insights on the latest market trends or see your potential stock’s support and resistance levels. The best stock market research & analysis software for 2026 have information on stocks worldwide. Some have free versions to get you on board with your first stock.
The following are the seven top stock analysis software programs based on our rankings:
- AltIndex: Artificial intelligence is a big part of AltIndex, from its analysis to company information, making it the best stock market research & analysis software. Stock alerts are available on several metrics to keep you updated. You can activate alerts for job postings, social media followers, stock sentiment, app downloads, etc.
- SharemarketCap: This platform is ideal for technical analysis, with ratings for each technical indicator. AI forecasts are also available to guide your decisions. Market mastery is available through candle and chart patterns.
- Trade Ideas: You can get AI signals and customizable alerts with this tool. In addition, the TI Simulator is available to help you build trading strategies in real-time.
- Benzinga Pro: This software provides breaking news and other updates that influence the market. You can customize the news feed to show updates on your preferred sources or sectors. Also, there is a chat room to ask questions, learn, and improve your trading strategy.
- TradingView: This platform is at the top of our social trading software recommendations. It has live streams, editors’ picks, and trending ideas. Also, you can trade directly with its integrated brokerages.
- TrendSpider: Thanks to its smart watchlist, trends are easily discoverable on TrendSpider. This list is easily customizable with filters to see trends with specific attributes.
- FinViz: This platform provides heat maps and candle charts for stocks. It also offers a screener to help you sort your portfolio.
Best Stock Market Research & Analysis Software Reviewed
AltIndex – Best All-around Stock Market Research & Analysis Software

This stock analysis software is ideal for those who have not decided on a stock. It offers remarkable insights, including AI predictions on stocks and cryptocurrency. You can quickly pick your first stock with the AI Stock Picker, purchase it, and start trading while monitoring the company’s performance.
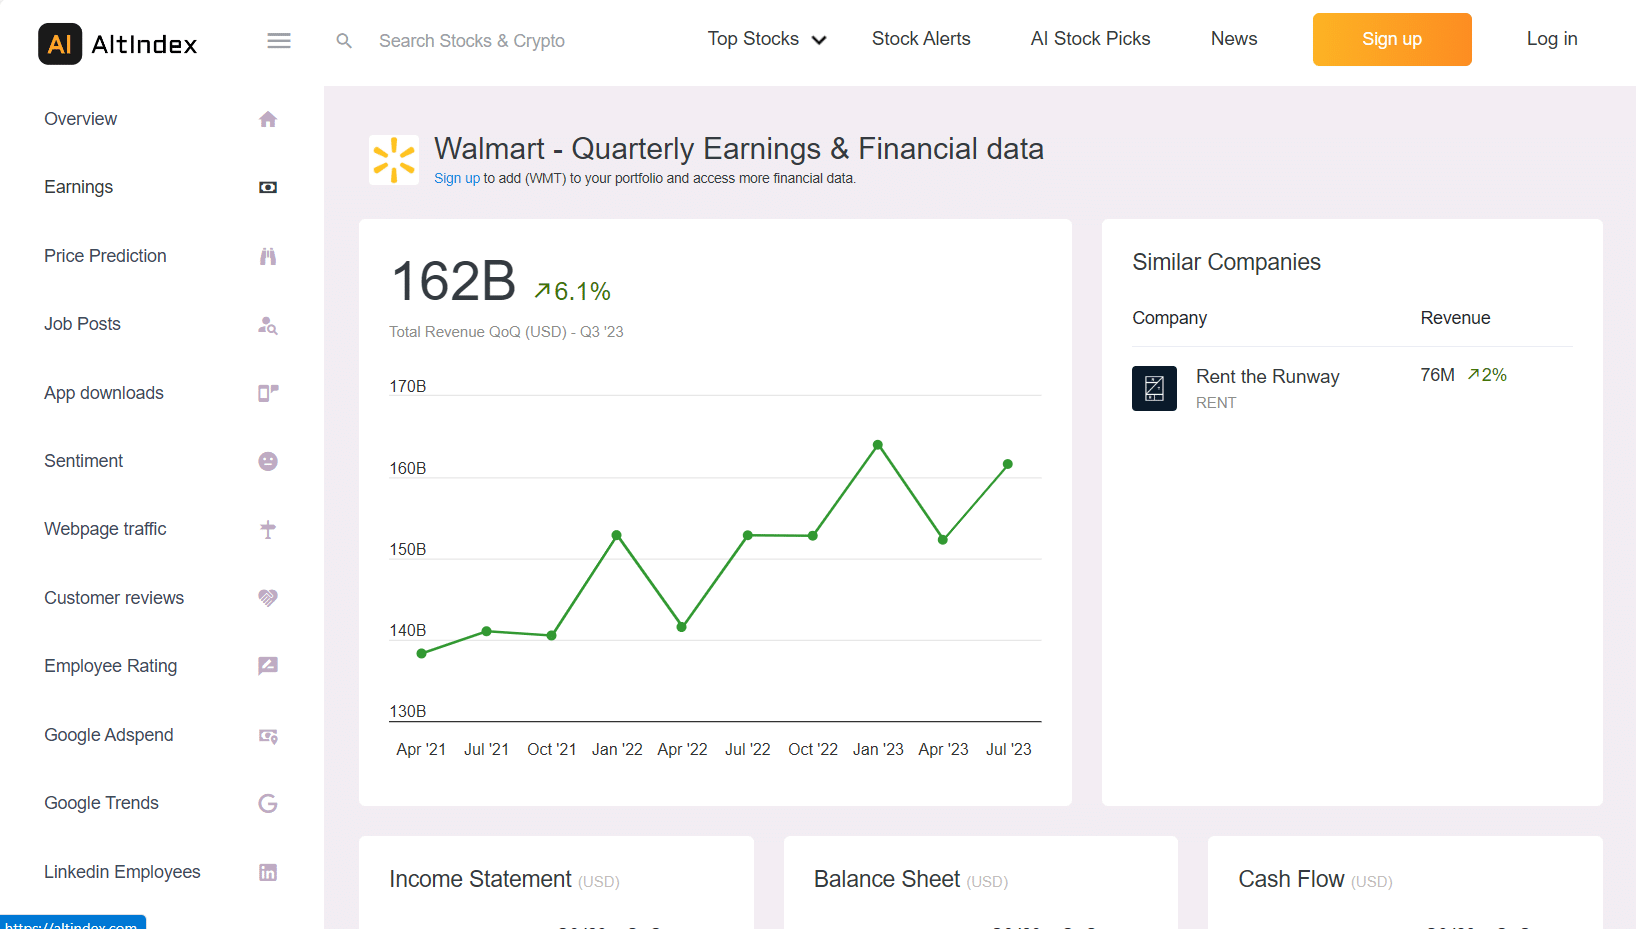
AltIndex has sections for the top ten and trending stocks to get you started. Click any stock to go to the analysis page for more in-depth information about the stock or company. This stock software tops our list because it provides not only analysis of stocks but also information on the company.

You can see the total earnings of the companies and other details, including job postings, website traffic, app downloads, and customer reviews. These details help conduct an extensive analysis of any stock or company, making AltIndex a valuable piece of software for trading.
The price prediction section is a must-have for anyone going into stock trading. You’ll find a price forecast for six months, enough to help you decide whether to purchase a stock. There is an AI score for added insights.
Stock alerts can be delivered to your account or email. Pricing is the major downside of this stock analysis software, as you’ll need at least $50 to extend your portfolio to 50 stocks.
Spec Overview Stock Alerts Provides daily alerts on several stock metrics, including sentiments, app downloads, job postings, etc. Statistics and Alternative Data Gain insights on sentiments, website traffic, employee ratings, customer reviews, and other alternative data. AI Score Provides predictions and forecasts for stocks  Pros:
Pros:- Provides alternative data
- It covers thousands of stocks, including the S&P 500 and Dow Jones.
- Provides company earning
Cons:- The free version is limited to only two alerts
- AI price prediction is not conclusive for success
SharemarketCap: Best for Technical Analysis

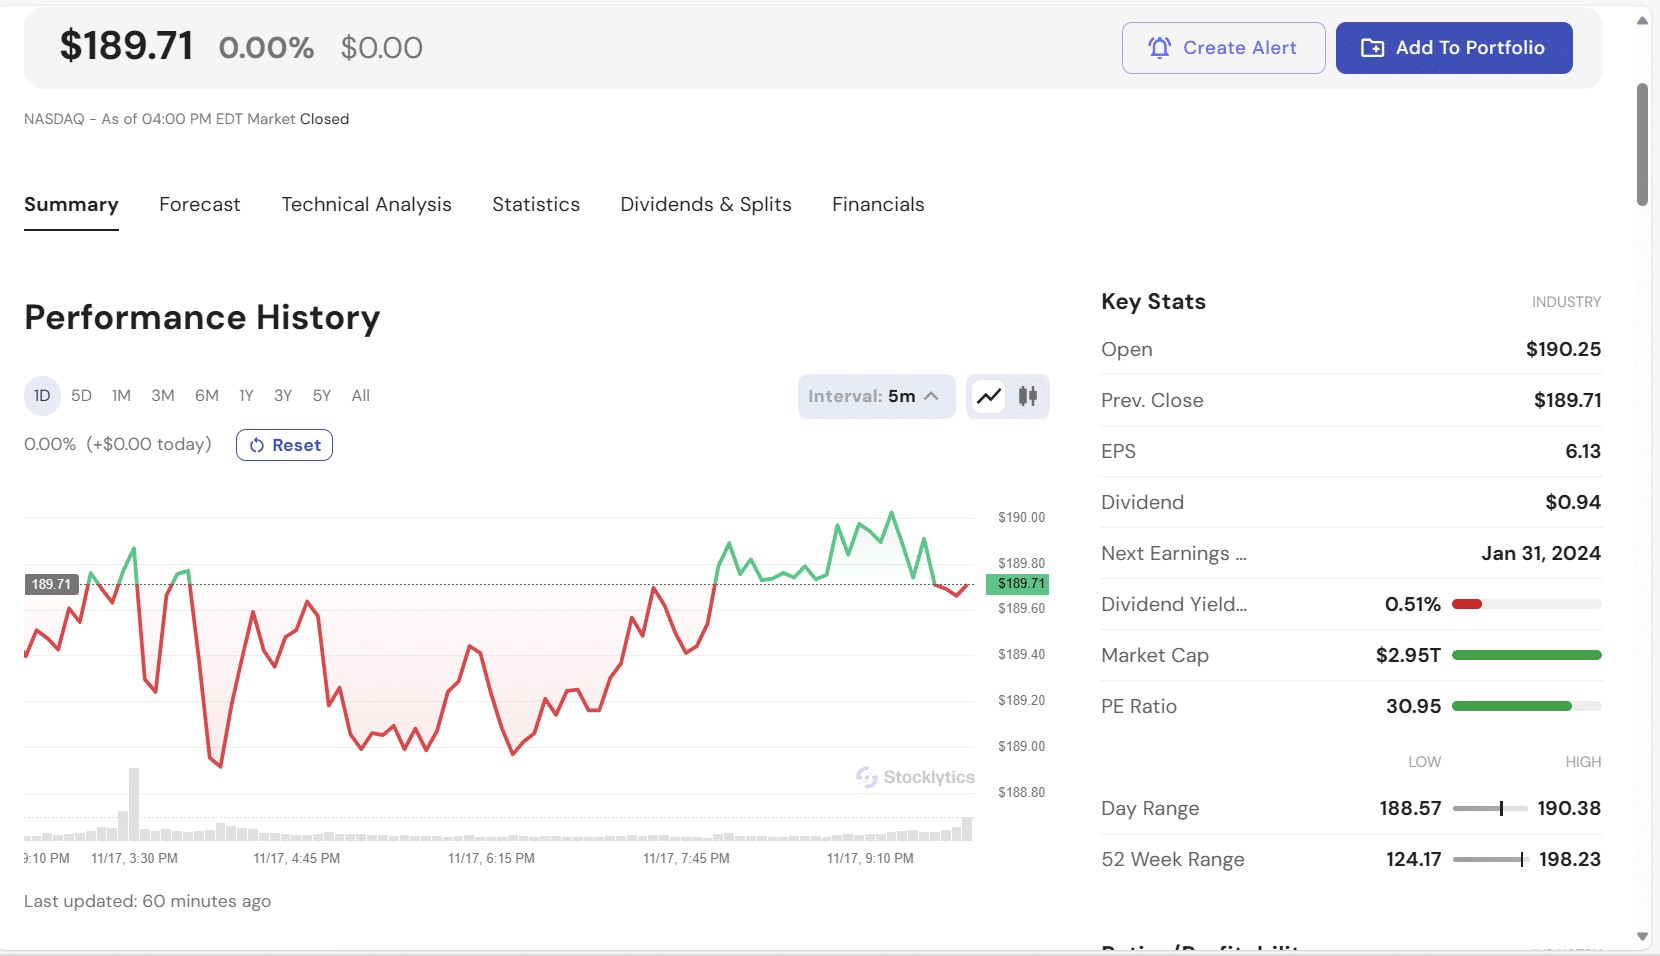
This software’s extensive coverage of stocks makes it one of the best investment tools to build a portfolio. You can see the all-time performance for any stock, with crucial information like dividends, day range, market cap, etc. SharemarketCap has thousands of stocks in all the industries you can imagine.
AI price predictions are available on this stock software. While we cannot wholly rely on it for trading decisions, it is a valuable addition to the performance history and other tools on the site. SharemarketCap is among the best stock market research & analysis software for 2026.

You can see analyst ratings for stocks and compare them with those of other correlated companies. The technical tools in this stock analysis software are extensive, including relative strength index, moving average, rate of change, etc. Others include Williams %R, average directional index, and stochastic.
Those who understand Fibonacci retracement in technical analysis can quickly switch to that section. You can switch to the classic view to analyze the stock if that looks complex.
The technical indicators on this platform show results for one day, week, or month. SharemarketCap also provides ratings on each indicator to help you decide whether to buy or sell a stock. Click any indicator to see the graph and have a better visual comprehension of the information.
SharemarketCap provides financials for each stock. You can see each company’s income statement, balance sheet, and cash flow.
Spec Overview Technical analysis Provides technical indicators like moving average convergence divergence, rate of change, stochastic, etc. Stock screener Used to narrow down stocks that meet individual investment strategies Pros:- Provides technical indicators with ratings
- Provides insights into company financials
- A stock screener is available to trim stocks based on your objectives
Cons:- Suitable only for expert traders
- Expensive premium version
Trade Ideas: Best for Real-time Day Traders

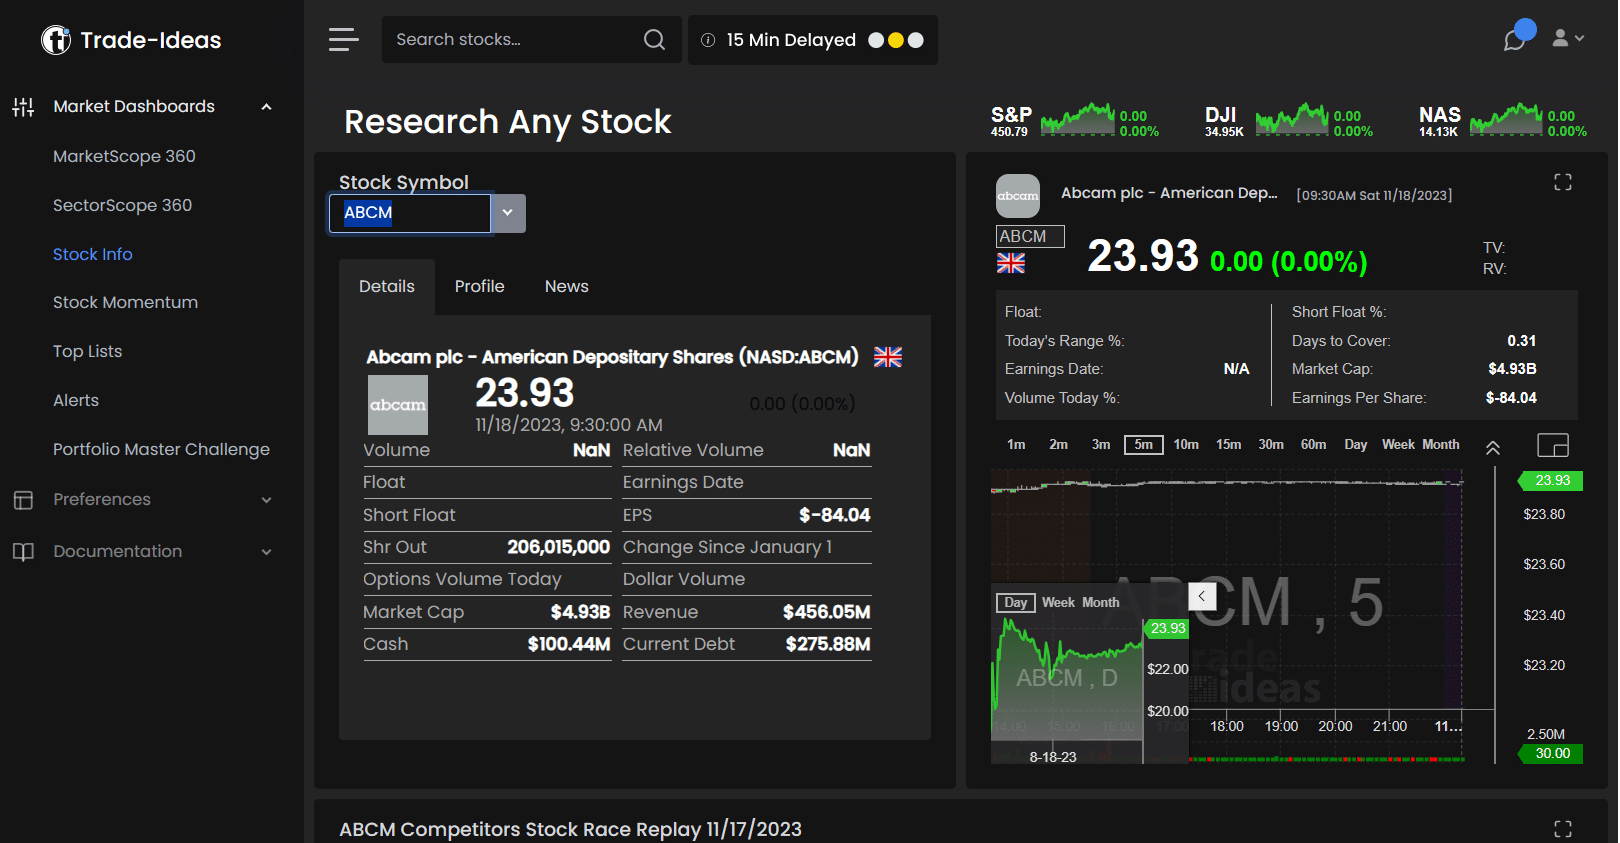
This platform provides the essentials and more for active, real-time beginners and expert traders. It is one of the best day trading apps, but it is also valuable as research and analysis software. You can use your mobile devices to access the platform anywhere you are.
Trade Ideas Technology brings several technological innovations, including AI trading signals. Customizable alerts and advanced chart capabilities are also available. The latter involves a picture-in-picture display, which allows you to view two charts simultaneously.
This picture-in-picture feature speeds up the analysis process, giving you the speed for trading decisions. Time-saving visualization is an essential component of Trade Ideas, but two things make the platform stand out: the TI Simulator and the brokerage integration.

The TI Simulator is ideal for beginners to practice and master day trading. It uses actual market conditions to get you used to the tension and flow. Experts can also use the simulator to evaluate new strategies and test automation.
Trade Ideas offers automated trading with its supported online stock trading software programs. The APIs will allow you to connect to the supported brokerages and automate your trading.
The stock info window provides a few details about the stock, including information on the company. You’ll find visual representations on the side to help you understand the stock movement.
Trade Ideas also allows users to set alerts on their preferred stocks. While this platform suits day trading, it doesn’t provide many tools for long-term investors.
Spec Overview Market dashboards Provides info on stocks, including candle charts Brokerage API Provides integration with online brokers for automated trading Pros:- You can automate trades by linking your account to an online broker.
- Real-time reports for day trading
Cons:- The platform is not ideal for long-term research and analysis
- The entry-level fee is relatively expensive
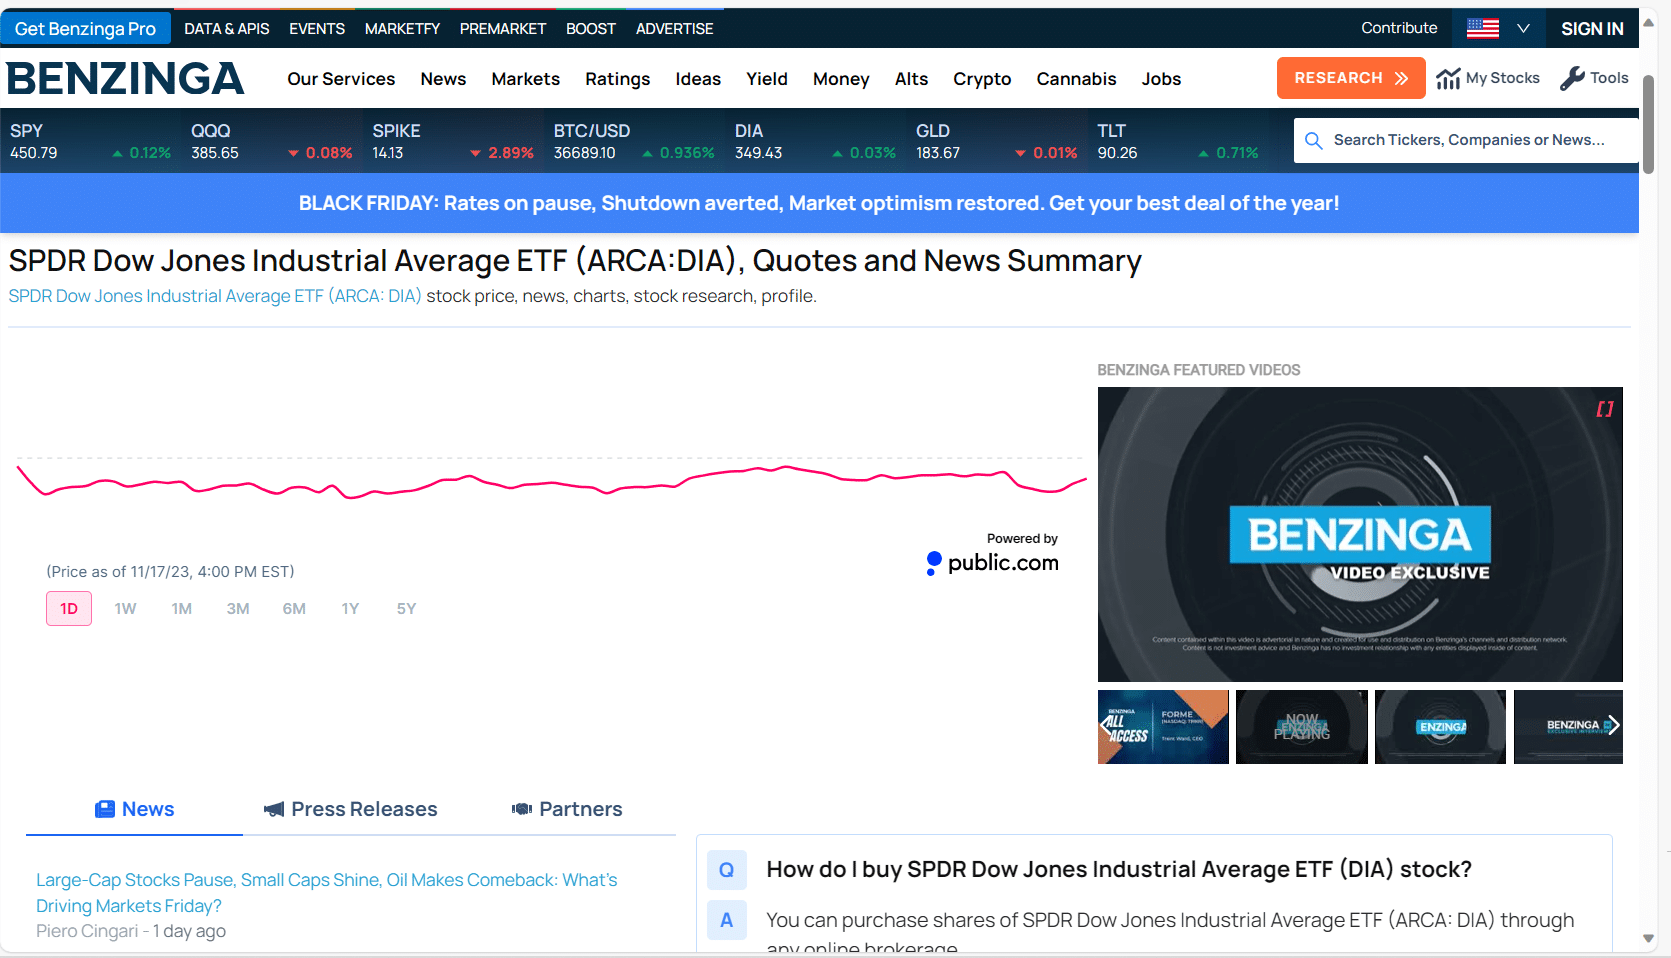
Benzinga Pro: The Best News Platform for Stock Research

News is essential for stock trading. It is a vital component for an all-around analysis before making trading decisions. The next best thing to getting the correct information is getting it quickly before a trade closes.
Benzinga Pro offers extensive research capabilities through its actionable news. You don’t need to wait for major news networks to drop the headlines.
The news search offers keyword-direct search with filters. You can customize the news feed to show only headlines from sources and targets related to your trading strategy.
Besides providing key headlines, you can receive alerts that extend into options trading, including stock picks. These suggestions come from professional day traders.

Benzinga Pro has a chat room to ask questions, take suggestions, and improve your trades. Other features on the platform include movers, scanners, screeners, news feeds, calendars, and signals.
Spec Overview Scanner Used to identify trades Signals Identifies price spikes, block trades, opening gaps, highs, and lows Pros:- It offers trading education and mentorship from leading traders
- It provides a real-time scanner to identify high-potential trades
- It links stories with positive and negative indicators in real-time.
Cons:- The free plan is too basic to give ample information about trading
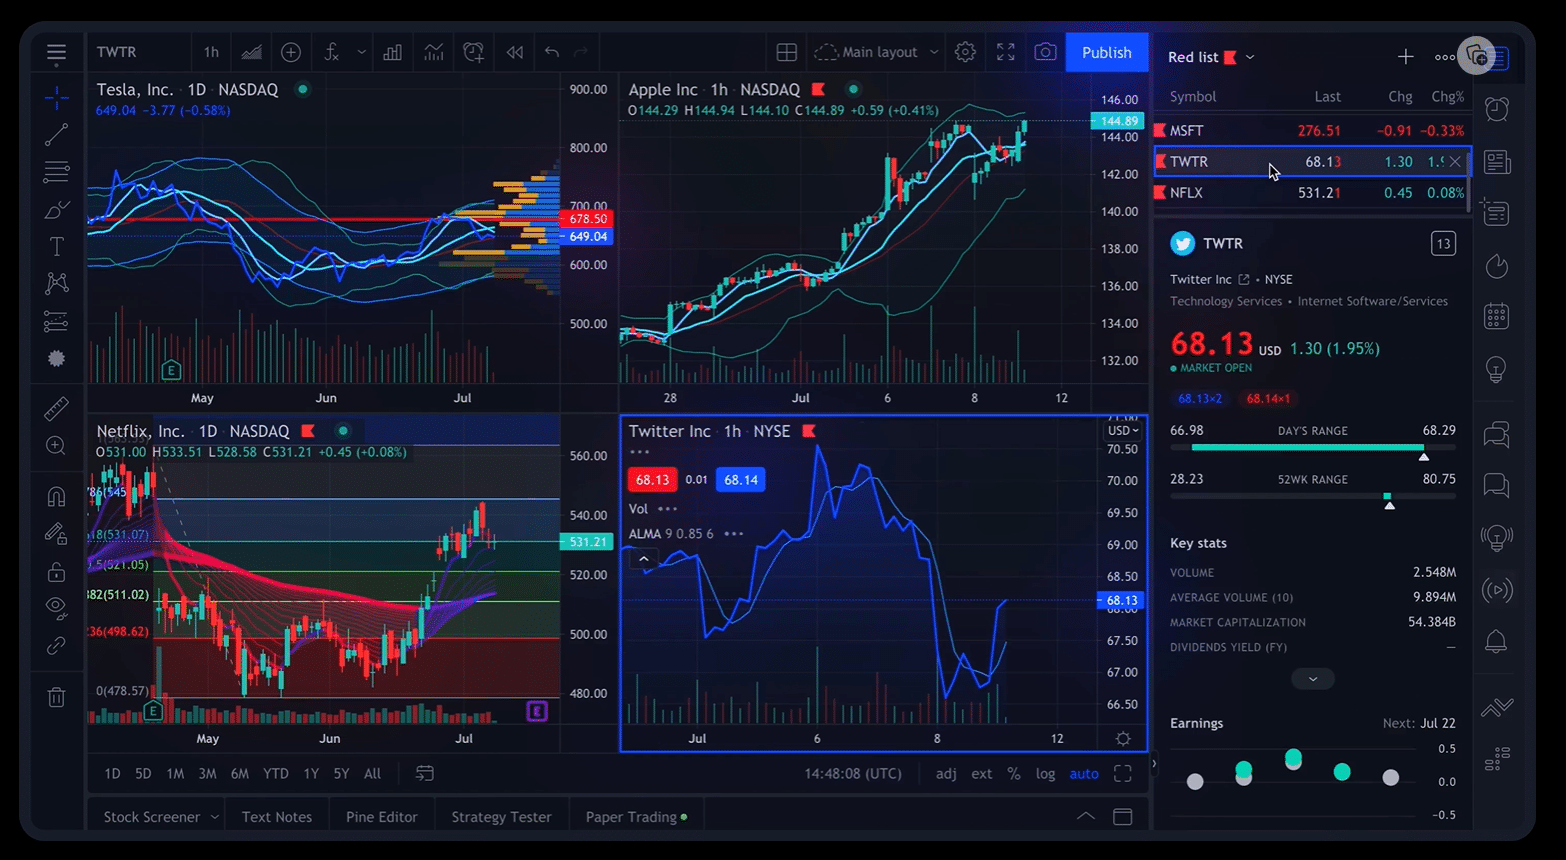
TradingView: Best for Social Trading

The most prudent move is to learn as much as possible about any stock before trading. TradingView is prominent for its analysis features but is among the best social trading software programs. For the social part, the platform features live streams, editors’ picks, trending ideas, and several educational programs.
TradingView categorizes its stocks into US-based and global stocks. You can also select specified countries like Japan, The United Kingdom, Canada, Australia, etc.
The platform provides exclusive details on the most-researched lists. You can get analyst recommendations.
TradingView offers supercharts, screeners, and an economic calendar. However, its most prominent feature is the Pine Script.

The Pine Script programming language allows traders to build strategies and indicators for trading. Its users have created and shared over 10 million custom scripts.
TradingView supports a few online stock trading software programs. You can trade directly on them using the platform’s supercharts.
Spec Overview Pine script A programming language used to build trading indicators and strategies Stock heat map Shows stock performance at a glance Pros:- Mobile and desktop applications are available
- It supports online trading through its supercharts
- A stock screener is available to customize your portfolio
Cons:- No stock rating or predictions
- It is not ideal for beginners
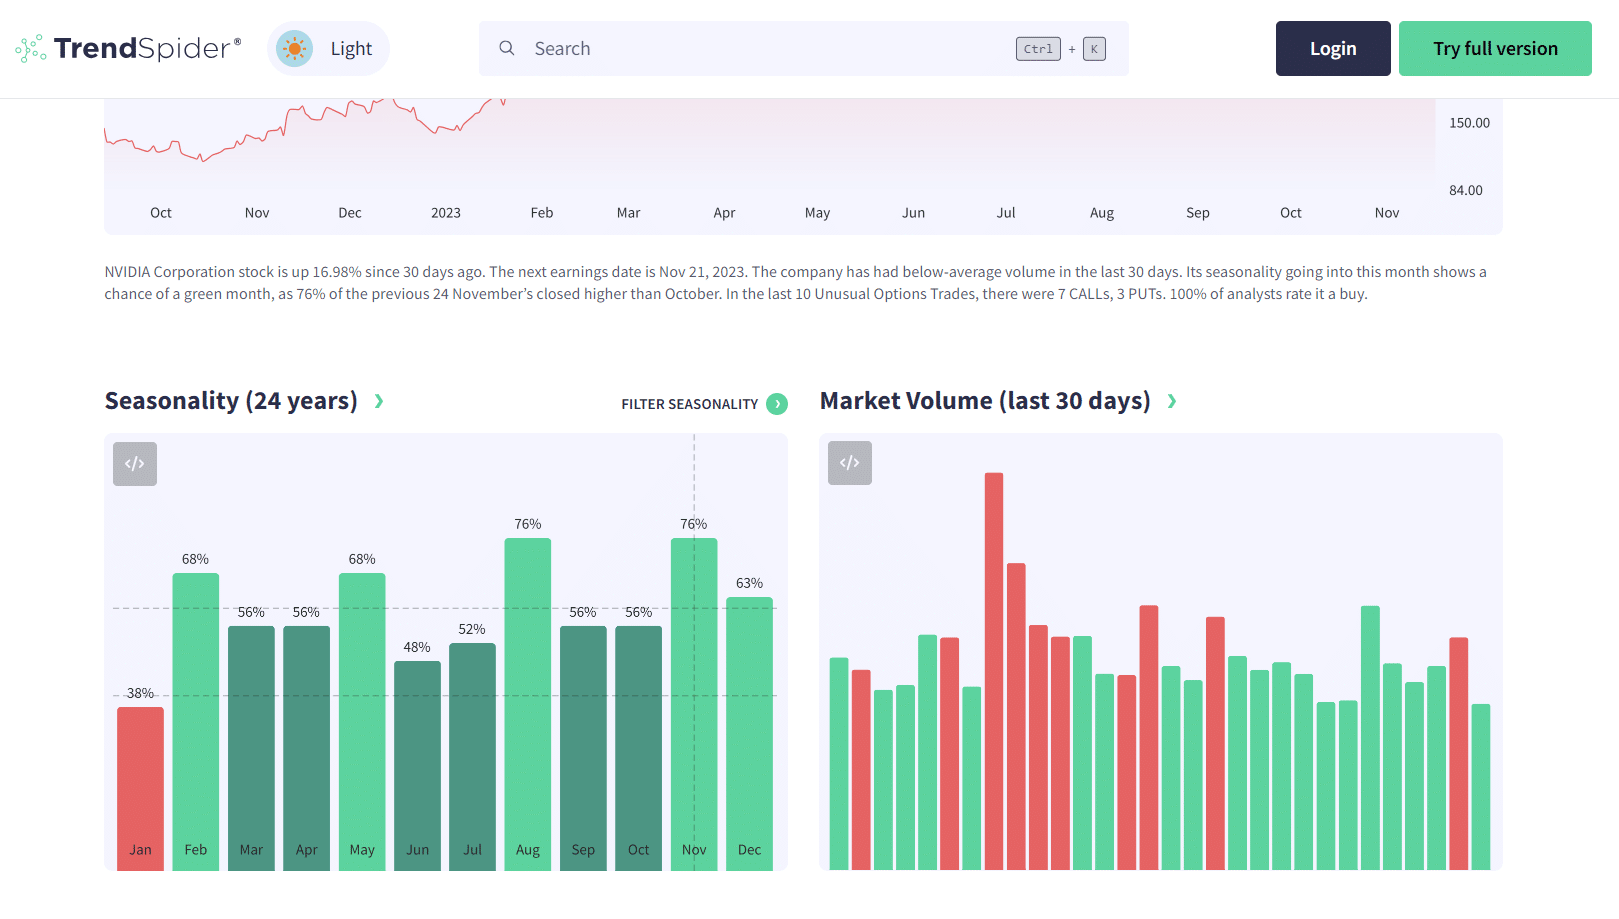
TrendSpider: The Best Stock Market Research & Analysis Software for Scenario Searches

This platform simplifies the process of finding specific scenarios in the market. It does this in real-time, allowing you to catch trends and trades as they occur. You can use the smart watchlist to filter the trades, scan the market, obtain data flow in real-time, and get your preferred results.
TrendSpider is your go-to stock analysis software to create and improve trading strategies. It offers backtests and forward tests for your trading ideas. Use TrendSpider’s Strategy Tester to develop, evaluate, and refine your strategies for better trading decisions.
The charts and analysis features of this platform cover over 200 indicators. You can analyze your charts and data with native automated pattern recognition and multi-timeframe analysis. Save time with automated technical analysis.

Dynamic price alerts and automated trading bots on the platform allow you to time your trades. Overall, TrendSpider offers tools for generating trade ideas, strategy discovery, timing and execution, charting, and analysis.
Spec Overview Strategy Tester Used to create and test trading strategies Charting and Analysis Allows for automation of chart analysis functions Pros:- Automated technical analysis is available
- It offers tools to develop and test trading strategies in real markets
- It offers a free trial
Cons:- It is not ideal for beginners
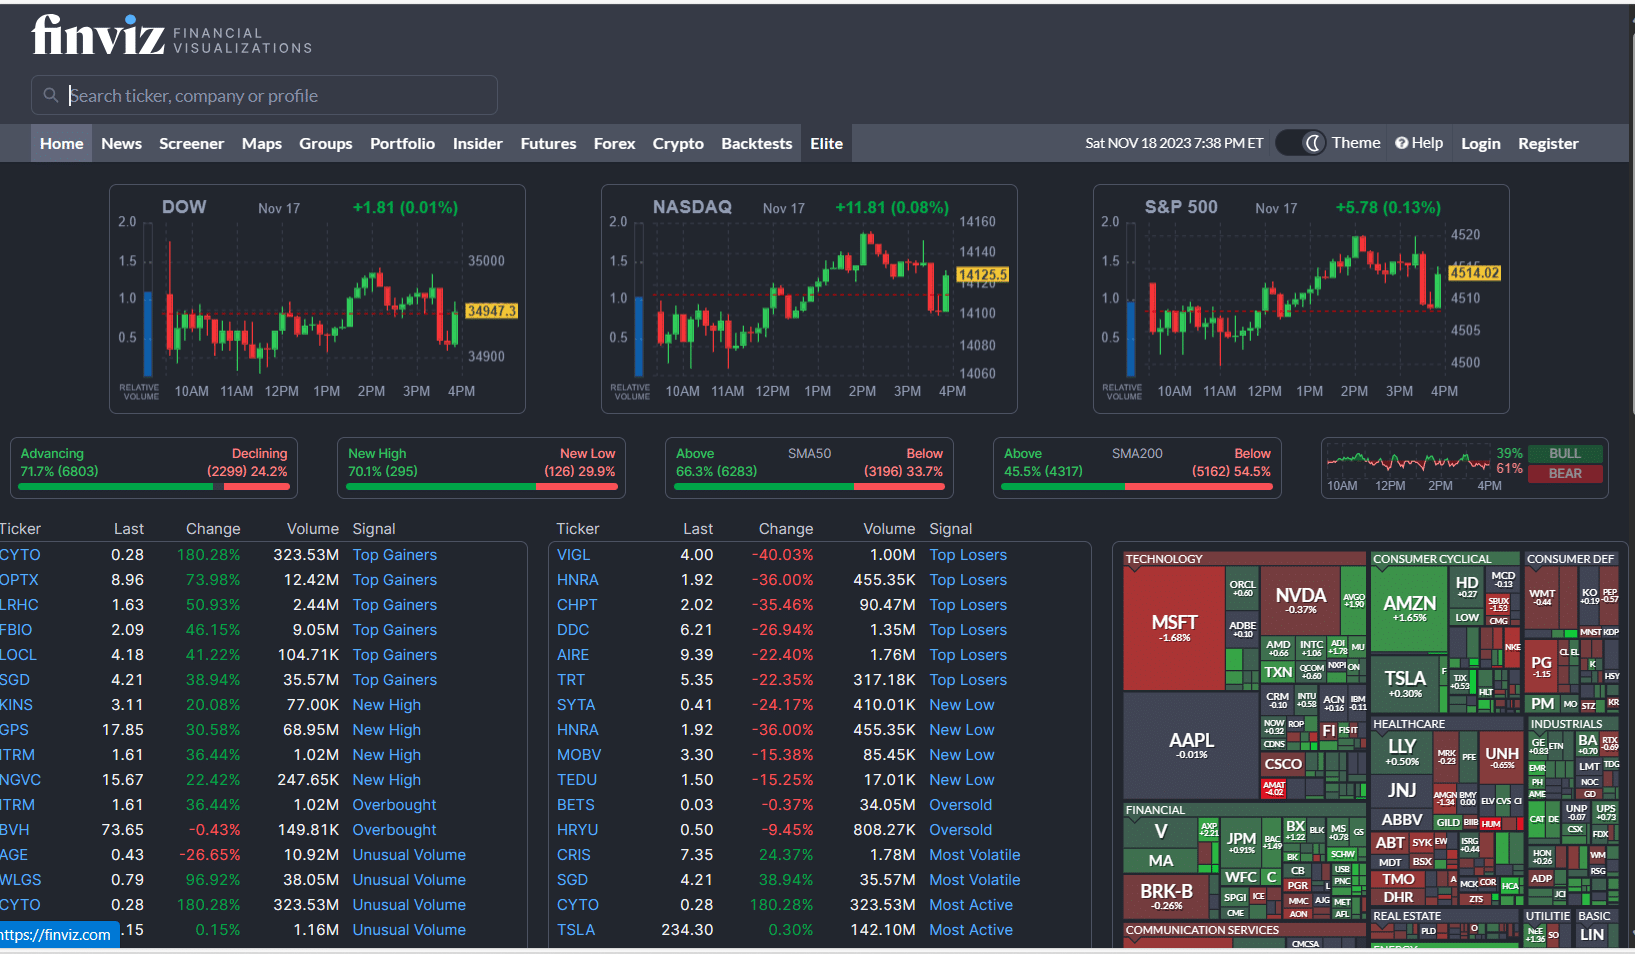
FinViz: The Best Stock Market Research & Analysis Software for Visualizations

This platform is for you if you need glances at candle charts and information on volume and signals. FinViz’s extensive visualizations are among the best in the industry. It also provides heat maps to help you quickly discern performing and non-performing stocks.
The Elite subscription starts at $24.96 per month, bringing access to several premium tools. These include advanced charts, email alerts and notifications, advanced screeners with statistics, data exports, and custom filters, correlations, etc. Also, the layout is ad-free, giving you undisturbed visuals.

FinViz offers extensive filters, making it one of the best investment apps for stock trading. You can filter stocks by market cap, earnings date, target price, exchange, sector, industry, current volume, dividend yield, etc. Most importantly, this tool is free to use.
Spec Overview Screener Filter stocks with different metrics, including dividend yield, average volume, index, etc. Map View stock performance by colour, with size representing the market cap Pros:- Most features are free to use
- It has a stock screener
Cons:- It doesn’t provide stock recommendations
- It is unavailable as a mobile application
Price Comparison for the Best Stock Market Research and Analysis Software
The table below shows the price comparison between our recommended research and analysis software programs:
Stock Analysis Software Price AltIndex From $29 Sharemarketcap $240 per year Trade Ideas From $84 per month Benzinga Pro From $27 per month TradingView From $12.95 per month TrendSpier From $19.92 per month FinViz $25.96 How Does Stock Market Research and Analysis Software Work?
The software programs above provide data and analytical tools to make sense of it. They also categorize data for easy research. For example, you can find information on a company’s market cap, average volume, dividend price, etc.
To understand how these research and analysis software tools work, we must break them down. First, we have the research functionality. Benzinga Pro is a prominent example of a research tool, as it provides news to help you assess stock performance.
Then, we have the analysis functionality. This part primarily involves analyzing a stock’s performance over time. It is where you’ll start hearing technical terms like moving average, relative strength index, resistance levels, trend lines, etc.
With that in mind, let’s explain how the research and analysis work.
How Research Software Works
Research tools provide details about a company’s financial health. These can include valuation metrics, news on SEC filings, dividend prices, and total revenue. Some tools, like AltIndex, offer alternative data services like job postings, customer reviews, app downloads, website traffic, etc.
These tools might present this information graphically for easy comprehension. You can use it to assess a company’s performance. If you have any investment strategies, this is the time to identify stocks that fit them.
Research tools focus more on companies, with brief insights into stock price fluctuations. The latter is to help you determine if the stock is overvalued or undervalued.
With these tools, you can compare financial information across multiple companies in the same industry. If you are new, research software should be your starting point.
How Analysis Software Works
Analysis is the next step after research. You can quickly get the price movement of a stock from its inception. However, you need analytical tools to examine and predict where it might be.
Analysis software takes information from research (financial health), adds that to technical tools, and evaluates the stock. The primary data these tools consider is the stock’s historical price.

You’ll find more charts and graphs in the analysis tools than their research counterparts. Some combine both functions, like those mentioned on this page.
Technical indicators are essential in these software programs. They include moving average convergence divergence (MACD), average directional index, relative strength index, stochastic oscillator, on-balance volume, etc. You can customize these indicators for your strategy.
TradingView allows you to create your own indicators or borrow from others. You can also set up stock alerts using these indicators.
Some analysis software programs allow you to automate your trades. They have APIs that connect to trading software, allowing you to execute your trades quickly.
You might find charting tools on online brokerages. However, they are often less advanced than what exclusive analysis software offers.
Popular Technical Indicators for Stock Trading
Technical indicators do not provide conclusive predictions about a stock’s performance. However, they can help you gauge the market better.
If you want to improve your stock trading with research and analysis software, here are some popular technical indicators to consider:
- Moving Average: This indicator gives the average price of a stock over specified periods. They smooth fluctuations, allowing you to see the direction and strength of the trend. You can overlay two or more moving averages to see where trends change.
- Moving Average Convergence Divergence: This tool measures the difference between two moving averages and plots a signal line. You can use it for 6-month or 12-month moving averages.
- Stochastic Oscillator. This indicator compares the closing price of a closing stock to its price range over a specified period. It helps identify overbought or oversold conditions in the market. With that, you can tell if a security is prone to a pullback or bounce.
- Relative Strength Index: This tool uses a 1–100 scale to measure the speed and change of price movements. Divergences between the price and the RSI can point to a trend reversal.
- Trend lines: These lines connect two or more price points in a stock’s history. They can indicate a trend (bullish or bearish).
How to Pick the Best Stock Market Research & Analysis Software
You don’t have to settle for only one stock market research & analysis software. If you have the budget, we’d recommend combining at least two with varying strengths. That said, here are some things you must consider when picking a platform for your trading or investments:
Investment Style
If you prefer high-growth stocks that rely more on sentiment, software that provides news and alternative data is the best. This platform will help you keep up with happenings that can boost or reduce the price. AltIndex and Benzing Pro are ideal examples for keeping up with sentiments.
You’ll also need platforms that offer quick analysis. With sentiment comes the need for speed. Your trades must be executed swiftly before the sentiment swings against you.
You can even automate your trades on some platforms. Slow and steady growth stocks do not require heavy news or sentiment reviews. Hence, you need platforms with more analytical tools to help you pick the best stocks.
Pick platforms that allow backtests and forward tests. They will help you test your strategies and refine them using real-market conditions. TrendSpider’s Strategy Tester and TradingView are excellent platforms that allow users to build strategies.
Investment Term
Some stock market research & analysis software mentioned on this page caters to short-term trading. Trade Ideas is an example, which caters to day traders. These platforms have quick research and analysis tools, making them ideal for short-term trading.
You can find platforms that integrate with online trading software to help you trade quickly. There might be a provision to automate your trades using specific metrics.
Quick research and analysis are unnecessary for long-term traders. If you are one, opt for platforms that provide more extensive data and analytical tools. SharemarketCap is ideal for long-term traders.
Identify how long you can bear the risk of trading. Then, go with the software that provides tools to that end.
Alternative Data Availability
Seeing the historical price of security is vital. You can quickly use technical indicators to gauge the performance and predict the price. However, alternative data has a heavy influence on stock prices.
A company laying off thousands of workers can cause a lack of trust, resulting in a stock crash. Most analysis software platforms will not have this information. Benzinga Pro is software that provides news but also adds analysis.
Pick platforms that offer news reports if your preferred companies are always in the news. That will help you keep up with developments and make trades when necessary.
How News Affects Stock Prices
Market prices often reflect investors’ total knowledge and expectations. Hence, they adjust when new information arrives. This information could be company earnings, new technology, shipping disasters, etc.
A significant example is the Samsung Galaxy Note 7 battery explosion news. Although this event occurred over an extended period, it still wiped $17 billion off Samsung’s market value. That proves that circumstances can affect stock prices substantially.
We recommend adding an alternative data service to your trading software. Set up news alerts for companies in your portfolio.
Build Your Portfolio
You can use stock market research and analysis software to build your portfolio. However, you should have a sector in mind before reviewing the platforms. That will narrow your search and quicken the review process.
TradingView can help you build a portfolio by showing what other expert traders pick. Once you’ve identified stocks that align with your investment strategy, you can review analysis platforms. You’ll be better positioned to select a good platform because you already know what you want.
Budget
An overall investment budget is vital before trading. The budget for stock market research and analysis software should be within that. Then, you can compare which platforms offer your preferred features and how much they cost.
The pricing in our comparison table is mainly for entry levels. You might spend more on more advanced features. Weigh these prices and choose the platform that offers you the best value for money.
Contact customer support if pricing information is unavailable for specific features.
Features and Analytical Tools
Review the features available on the platform before registering and paying the required fee. Ensure the features match your trading approach and include tools vital to your stock portfolio.
Besides having analytical tools, opt for platforms that are simplified. Some are better suited for expert traders who know how to use technical indicators and interpret charts.
It’s not about which platform has the most features for analysis and trading. Instead, opt for the ones that you can quickly understand. You can pick software programs that offer educational content to help you understand and use the tools available.
User Interface
For analysis, you’ll look at charts and graphs more often. The user interface affects the user experience. Hence, pick platforms that offer user-friendly designs.
Navigation should be easy with visible and well-placed buttons. In trading, the difference between profiting and losing can come down to a minute. Hence, the interface should be easy to move around, jump to sections or pages, and make quick decisions.
Mobile App Availability
The availability of a mobile application is not a deal-breaker. However, you’ll need a platform with one if you are primarily on the move with your smartphone.
Traders who remain in one place with desktops can do so without mobile applications. They can quickly use the mobile website to continue trading or monitoring when they step out. Still, a mobile application is an added advantage and is often more responsive than a website.
AI in Stock Research and Analysis
You’ll notice AI in some of the software recommended on this page. These platforms use AI to predict potential-performing stocks. They can even forecast stock prices months ahead.
Artificial intelligence uses machine learning and analyzes sentiments to predict stock performance. They process the same data (alternative data) we see but with complex algorithms that improve their efficiency. AI has gotten so good that AltIndex reports a 75% win rate on AI stock picks.
The use of AI is transforming the consumer experience. However, we advise applying caution when using it. Do not over-rely on their predictions or picks for your trading decisions.

Conclusion
Grounded research and analysis are essential for success in stock trading. Both apply to short-term and long-term investment strategies. Hence, you need robust stock market research and analysis software.
Fortunately, you have several options. You can combine several platforms to get the best of different worlds. For example, you can get one for regular news on companies in your portfolio while having another with extensive technical analytic tools.
AltIndex provides technical analysis but offers the added advantage of reviewing alternative data. It offers in-depth views into sentiments that can influence stock prices. These include job postings, website traffic, app downloads, customer reviews, employee ratings, etc.
You can set custom alerts at AltIndex. If that isn’t enough, the platform’s AI can provide stock picks for your next trades. Sign up for the free version to learn more about its features.

References
- https://www.cbsnews.com/news/the-impact-of-news-events-on-market-prices/
- https://www.wsj.com/articles/global-stock-markets-dow-update-10-27-2021-11635319937
- https://money.cnn.com/2016/10/11/technology/samsung-galaxy-note-7-what-next/index.html#
- https://www.forbes.com/sites/forbesbusinesscouncil/2022/05/05/the-future-of-ai-5-things-to-expect-in-the-next-10-years/?sh=2a49ffba7422
FAQs
What is the best software to analyze the stock market?
The best software to analyze the stock market is the one with advanced technical indicators and signals. We pick AltIndex, as it has analytical tools and alternative data analysis for broader coverage. However, you must consider other features like alerts, screeners, strategy builders, user interface, stock coverage, etc.
Which software is used for stock analysis?
Popular software for stock analysis include AltIndex, SharemarketCap, Trading Ideas, Benzinga Pro, TradingView, etc. Some of these tools have free versions to get you started.
Is there a software to predict the stock market?
AltIndex offers AI predictions and picks for stocks. It uses machine learning and in-depth analysis of sentiments and price history to determine stock performance.
Is there a software that tells you when to sell and buy stocks?
AltIndex and SharemarketCap provide AI stock picks. They rate stocks, showing which ones you should buy or sell.

Jeremiah Awogboro

Jeremiah Awogboro
View all posts by Jeremiah AwogboroJeremiah Awogboro is an experienced content writer with over 8 years of experience. He has a qualified MBChB degree and a keen interest in the stock market and the finance industry. His background in the industry has provided him with valuable experience in this field. Awogboro is dedicated to assisting and reaching out to as many people as possible through his writing. In his spare time, he enjoys music, football, traveling, and reading.
eToro: Overall Best Stock App with 0% Commission
VISIT ETOROYour capital is at risk. Other fees apply. For more information, visit etoro.com/trading/fees.stockapps.com has no intention that any of the information it provides is used for illegal purposes. It is your own personal responsibility to make sure that all age and other relevant requirements are adhered to before registering with a trading, investing or betting operator. Contracts for Difference (“CFDs”) are leveraged products and carry a significant risk of loss to your capital. Please ensure you fully understand the risks and seek independent advice.By continuing to use this website you agree to our terms and conditions and privacy policy.
Trading is risky and you might lose part, or all your capital invested. Information provided is for informational and educational purposes only and does not represent any type of financial advice and/or investment recommendation.
Crypto promotions on this site do not comply with the UK Financial Promotions Regime and is not intended for UK consumers.
© stockapps.com All Rights Reserved 2026
We use cookies to ensure that we give you the best experience on our website. If you continue to use this site we will assume that you are happy with it.Scroll Up
 Pros:
Pros: