What are Moving Averages in Trading? – Trading Essentials

You’ve probably looked at trading charts and wondered, what are moving averages in trading? First, moving averages are technical indicators and, like the rest, can reveal patterns for trading decisions. Stocks can have rapid up-and-down price movements, but even that has an underlying trend and direction.
Recognizing trends with short-term price data can be challenging, especially in a volatile market. Hence, many traders use moving averages to recognize trends and trading opportunities. The same applies to investors who want profitable assets for the long term.
New traders and investors often wonder what moving averages in trading are. The indicator can be tweaked to help with short-term trades or long-term investments. With that in mind, let’s delve into this technical indicator and its applications for better decision-making.
-
-
What are Moving Averages in trading? – Introduction
Technical analysis indicators, including overlays and oscillators, beam the searchlight to bring out patterns. They rely on historical trading activity to discover statistical trends. Conversely, fundamental analysis focuses on the business fundamentals.
These indicators apply to charts (candlesticks, bars, lines, etc.). You’ll find them on prominent stock analysis and trading apps. However, using them exceeds pressing a button and applying them to the chart.
The definition is the simplest part as we discuss what moving averages in trading are. The real work comes from applying and tweaking it to give you the best statistical trend. Let’s see the concept and its calculation.

Definition and basic concept of moving averages
A moving average is the trading price average of “n” number of periods. You can use it for 5, 10, 50, 100, and even 200 days. The tool calculates the average trading price for your specified number of periods, but it goes further.
This calculation moves one period forward to give the value for the next calculated period. In so doing, the moving average smooths out price fluctuations with a more even curve.
By filtering out the noise, you can discover trends, crossovers, support, and resistance levels. The concept is simple. You can have a simple moving average (SMA), which weighs all data points equally, or an exponential moving average (EMA), which emphasizes recent prices.
The good thing about this indicator is that you can quickly apply it to the price chart. That’s why we encourage using the best trading apps for ease of use.
How moving averages are calculated and their significance in trading
Let’s demonstrate the calculation with hypothetical price data. While you won’t need to calculate it yourself, the formula is worth knowing. Besides, there is no better way to understand our explanation than knowing how to calculate it.
The table below shows hypothetical price data:
Period (days) Price ($) Moving average 1 90 – 2 95 – 3 80 – 4 90 – 5 100 A 6 105 B 7 85 C 8 70 D Let’s assume we use a five-day period for our moving average. We can only calculate on the 5th day. The first four days are not up to five to take an average.
Therefore,
A = [price (1) + price (2) + price (3) + Price (4) + price (5)] / 5
= [90 + 95 + 80 + 90 + 100] / 5
= 91$
B = [Price (2) + price (32) + price (4) + Price (5) + price (6)] / 5
= [95 + 80 + 90 + 100 + 105] / 5
= 94$
Notice how we move one period forward for the next average. That is why the indicator is called a moving average.
Once overlaid on the chart, you’ll find a smoother curve than the price movement. This smooth curve helps to discover the underlying asset trend (uptrend or downtrend).
Disclaimer: Don’t invest unless you’re prepared to lose all the money you invest. This is a high-risk investment and you should not expect to be protected if something goes wrong. Take 2 mins to learn more.
Types of Moving Averages
Let’s move on from the basics to the types. Each type produces a different curve, and you can use them in several ways. For example, EMAs give more weight to recent prices, favoring day traders more.

You’ll find different types of moving averages on day trading apps and long-term investment tools. Let’s get into them to see how they differ.
Simple Moving Average (SMA)
This is the average over a fixed period. All data points are weighted equally. Hence, you can quickly identify trends and reversals.
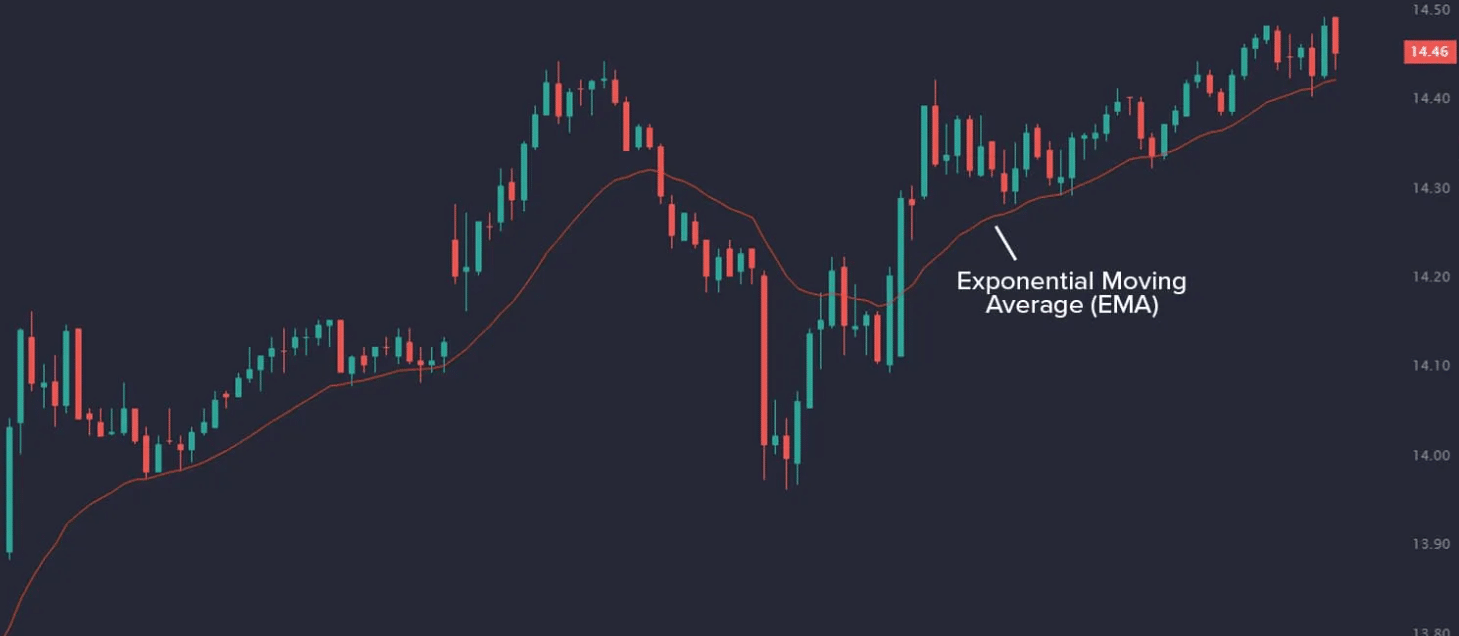
Exponential Moving Average (EMA)
This type shares the same formula as the SMA. However, the algorithm gives more significance to recent prices while making older prices less significant.

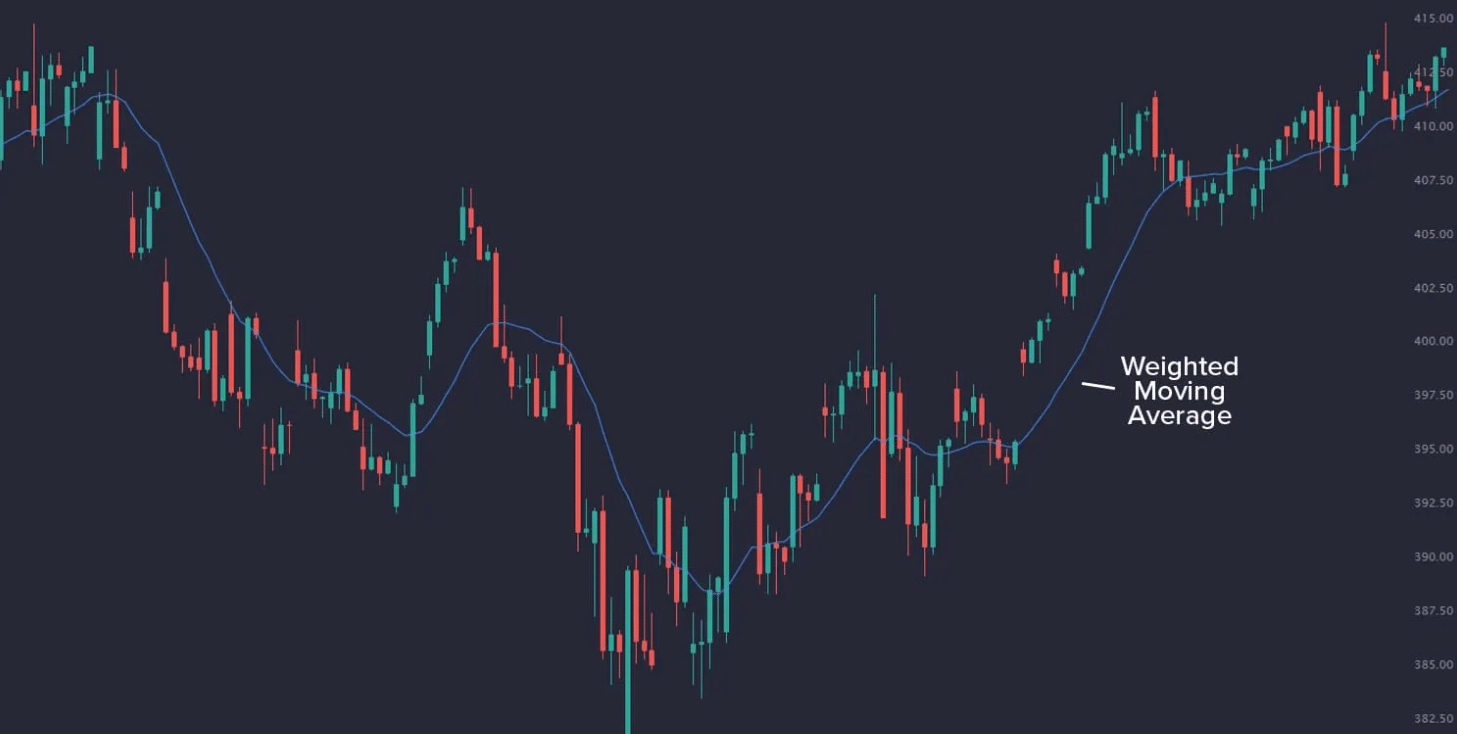
Weighted Moving Average (WMA)
This option gives the most flexibility. You can attach different weights to the data points: recent, in-between, older, etc. Hence, the weighted moving average allows you to focus on specific data points for trend identification.

Moving Average Crossover Strategy
You can overlay several moving averages on one chart. Traders use this strategy to identify crossovers, which generate trading signals. Also, the strategy is often applied to identify entry and exit points.
Moving averages in trading hold much value worth exploring to the fullest. A beginner trader would apply only one moving average to the chart, but we want you to do more. Let’s explain how much you can do with crossovers.
Definition and explanation of moving average crossovers
Moving average crossovers occur when the short-term and long-term averages meet. Of course, one would cross the other in an uptrend position, while the other would be in a downtrend position.
We recommend using different colors on the chart for easy recognition. The typical averages used in crossovers are simple and exponential moving averages.
Using moving average crossovers to identify trend reversals and entry/exit points
A close observation of the question “What are moving averages in trading?” reveals different moving averages. You can have more than one on a chart to generate crossovers. Notwithstanding, use the appropriate and recommended trading apps on our site.
Crossovers reveal bullish or bearish trends. These indicate entry and exit points.
A bullish trend might be an entry point for a short-term trader. Conversely, a bearish trend might be an entry point for a long trade. The choice depends on your trading goals and risk tolerance.
Identifying entry and exit points boils down to recognizing the patterns the crossovers produce. Even so, have stock market research and analysis software by your side. We’ll delve deeper in the next section.
Golden Cross and Death Cross
Our explanation of moving averages in trading will be incomplete without the golden and death crosses. These crossovers appear once you overlay the simple and exponential moving averages together. As mentioned, one must cross above the other, resulting in specific trends that aid trading.
For this context, we’ll assume that the short-term moving average is 50 days, and the long-term moving average is 100 days.
Definition and significance of the Golden Cross
The golden cross occurs when the short-term moving average crosses the long-term moving average from below. Hence, the SMA ends up above the long-term moving average.
Traders use this as an entry or exit point. However, that depends on whether it is a long or short trade position.
Overall, the golden cross forms a bullish technical pattern.
Definition and significance of the Death Cross
The death cross occurs when the short-term moving average crosses the long-term moving average from above. Hence, the SMA ends up below the long-term moving average.
Traders can take a sell position as the market becomes bearish. However, you shouldn’t rely solely on the death cross.
Examples of Golden Cross and Death Cross in real-world trading
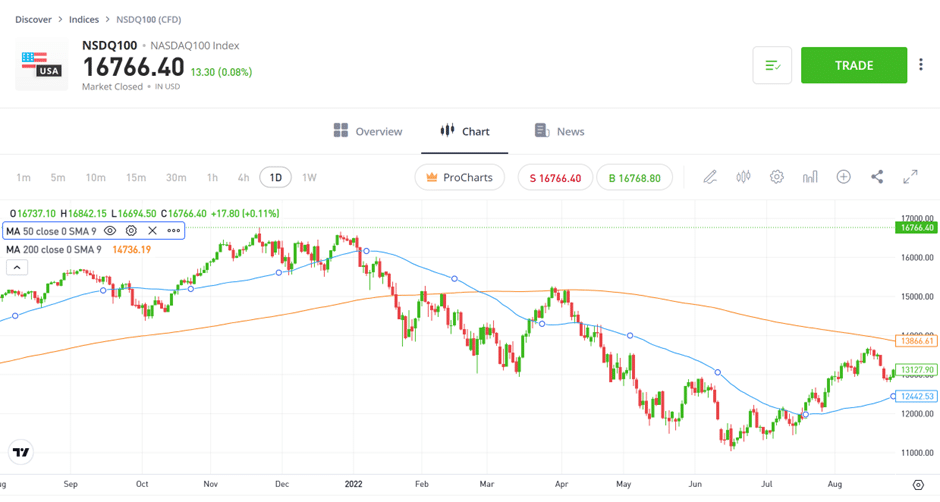
In the diagram below, the orange line is the long-term (200-day) moving average. The blue line is the short-term (50-day) moving average for the NSDQ100 index.
We can see a golden cross as the short-term moving average crosses the long-term moving average from below. It indicates a bullish trend.

You’ll see the Death Cross in March 2023. The trend is bearish, which can signify a sell position for some traders.
Disclaimer: Don’t invest unless you’re prepared to lose all the money you invest. This is a high-risk investment and you should not expect to be protected if something goes wrong. Take 2 mins to learn more.
Moving Averages as Support
You can use moving averages as support, just as you would trend lines. However, they are more dynamic, adapting to the recent price action.
This section on what moving averages are in trading is essential for buy and sell positions. Let’s see how traders will interpret it.
How moving averages act as support levels in an uptrend
Prices can dip and test the moving average. Some traders might interpret this occurrence as an opportunity to buy into the market. The opposite happens if the price rises and touches the moving average, indicating a sell opportunity.
The price might not bounce perfectly from the moving average. Sometimes, it can go past it before resuming the current trend.
Identifying potential buying opportunities near moving average support
You don’t trade when the price dips or rises towards the moving average. Instead, wait for a retracement or pullback. Use other indicators to identify oversold or overbought conditions before entering your trade position.
Moving Averages as Resistance
The moving average can act as resistance during downtrends. Again, you’ll need other indicators to make a better-informed trading decision.
How moving averages act as resistance levels in a downtrend
If the price rises to the moving average and bounces off it, the MA acts as a resistance. It shows that the trend is not strong enough to break into an uptrend.
Identifying potential selling opportunities near moving average resistance
Traders looking to sell can take this resistance movement as a trade signal. It can signify an ongoing downtrend and an exit position for traders.

Trend-Following with Moving Averages
We mentioned the smoother curve moving averages brought earlier on in our answer. Identifying trends is easier with a smoother curve than with the sharp movements in average charts. Hence, you can quickly make trading decisions for the short- or long-term.
Using moving averages to determine the direction of the trend
Determining a trend’s direction boils down to whether the moving average acts like a support or resistance. Price movements that constantly rise above the moving average indicate an uptrend. That can be a buy signal for traders hoping to enter the market.
The slope can also boost your perception of the trend’s direction. The higher it rises, the more bullish it is, and vice versa. Nevertheless, we recommend further validation with other indicators.
Combining multiple moving averages for stronger trend signals
The golden and death crosses result from combining two moving averages. Doing that can give you stronger trend signals. You can combine moving averages in the following ways:
- The dual moving average strategy: This approach involves overlaying two moving averages on the chart. One will be short-term, while the other will be long-term. Then, you can look for crossovers to identify the trend.
- The triple moving average strategy: You can use 10, 50, and 200-day moving averages. Again, look for crossovers and apply the same rule as above.
The Guppy multiple moving average indicator combines two groups of moving averages, each with different periods. This indicator is easy to apply and still serves the same purpose as the crossover strategy.
Moving Averages for Range-Bound Markets
We’ve largely explored what moving averages are in trading trending markets. However, how do you apply these indicators to range-bound markets?
The absence of clear uptrends or downtrends can be challenging for some traders. However, you can ace the market once you identify it.
How to identify range-bound markets using moving averages
The following are potential indicators of range-bound markets through moving averages:
- The moving average will flatten out during range-bound markets. That is because the price moves sideways, even though it might have ups and downs.
- The price oscillates more between the resistance and support levels. Fluctuations exist but are not strong enough to break the resistance or support levels.
- Crossovers may occur frequently. However, examine the proximity and slope of the moving averages. Crossovers during rangebound markets should be carefully examined.
- There will be lower volatility. You can use Bollinger Bands to see if the price contracts within the narrow range.
Trading during range-bound or sideways markets should be done carefully. Mixed signals may occur.
Strategies for trading within a range using moving averages
We’ll give you some strategies to help you during sideways markets. They include the following:
- Dual moving average crossover: You need short- and long-term moving averages in this strategy. A buy signal can occur when the short-term moving average crosses above the long-term moving average. The opposite generates a sell signal.
- Moving average envelope: This strategy involves placing two moving averages above and below the price. A standard deviation or a fixed price controls the distance between the moving averages. The signal can go into the buy position if the price meets the upper moving average.
Disclaimer: Don’t invest unless you’re prepared to lose all the money you invest. This is a high-risk investment and you should not expect to be protected if something goes wrong. Take 2 mins to learn more.
Moving Averages with Other Technical Indicators
Understanding what moving averages are in trading is a step forward but not enough on its own. Getting the best results comes from combining this tool with other technical indicators.
Combining moving averages with oscillators
The relative strength index (RSI) and the moving average convergence divergence (MACD) are prominent oscillators. They are more commonly used with moving averages. Here’s how you can combine them:
The RSI and the MA:
You can apply the price crossover strategy in this combination. Consider shorting if the price moves near the MA resistance while the RSI reaches overbought levels above 70%. Apply the reverse if the price moves near the support while the RSI goes below 30%.
The MACD and the MA:

A long position is viable if the prices close above the moving average and the MACD crosses above the signal line. The opposite is true if the prices close below the moving average.
Enhancing trading signals with moving average-based indicators
Moving average-based indicators can enhance your stock trading signals for better trades. We’ve only discussed the simple, weighted, and exponential moving averages, but there are more.
Review the divergences between the indicators and the price movements. They may show trend reversals, helping you identify entry and exit points.
Moving Averages for Risk Management
Trading comes with risks. It is not enough to ask: What are moving averages in trading? Instead, you must follow up with risk management and tolerance.
Besides trading, moving averages can help you minimize losses. They can be used in stop-loss settings and position size adjustments.

Using moving averages to set stop-loss levels
You can place your stop-loss just below the long-term moving average price. This approach avoids setting your stop-loss too close to the asset’s actual price.
Adjusting position size based on moving average signals
Position size refers to how much you invest. You can increase it if the moving average signals a strong uptrend. Crossovers and multiple moving average methods can help identify trends.
Decrease your position if a strong downtrend occurs. This wraps up our expository piece on what moving averages are in trading.
Disclaimer: Don’t invest unless you’re prepared to lose all the money you invest. This is a high-risk investment and you should not expect to be protected if something goes wrong. Take 2 mins to learn more.
Trading with Moving Averages: eToro Complete Guide
Walk through our exposition on what moving averages in trading are again. Once complete, the next step is to practice before actual trading. We recommend eToro because of its simplicity and $100,000 virtual portfolio.
This trading platform is available on Android and iOS devices. Follow the steps below to join the platform and start practicing with the moving averages.
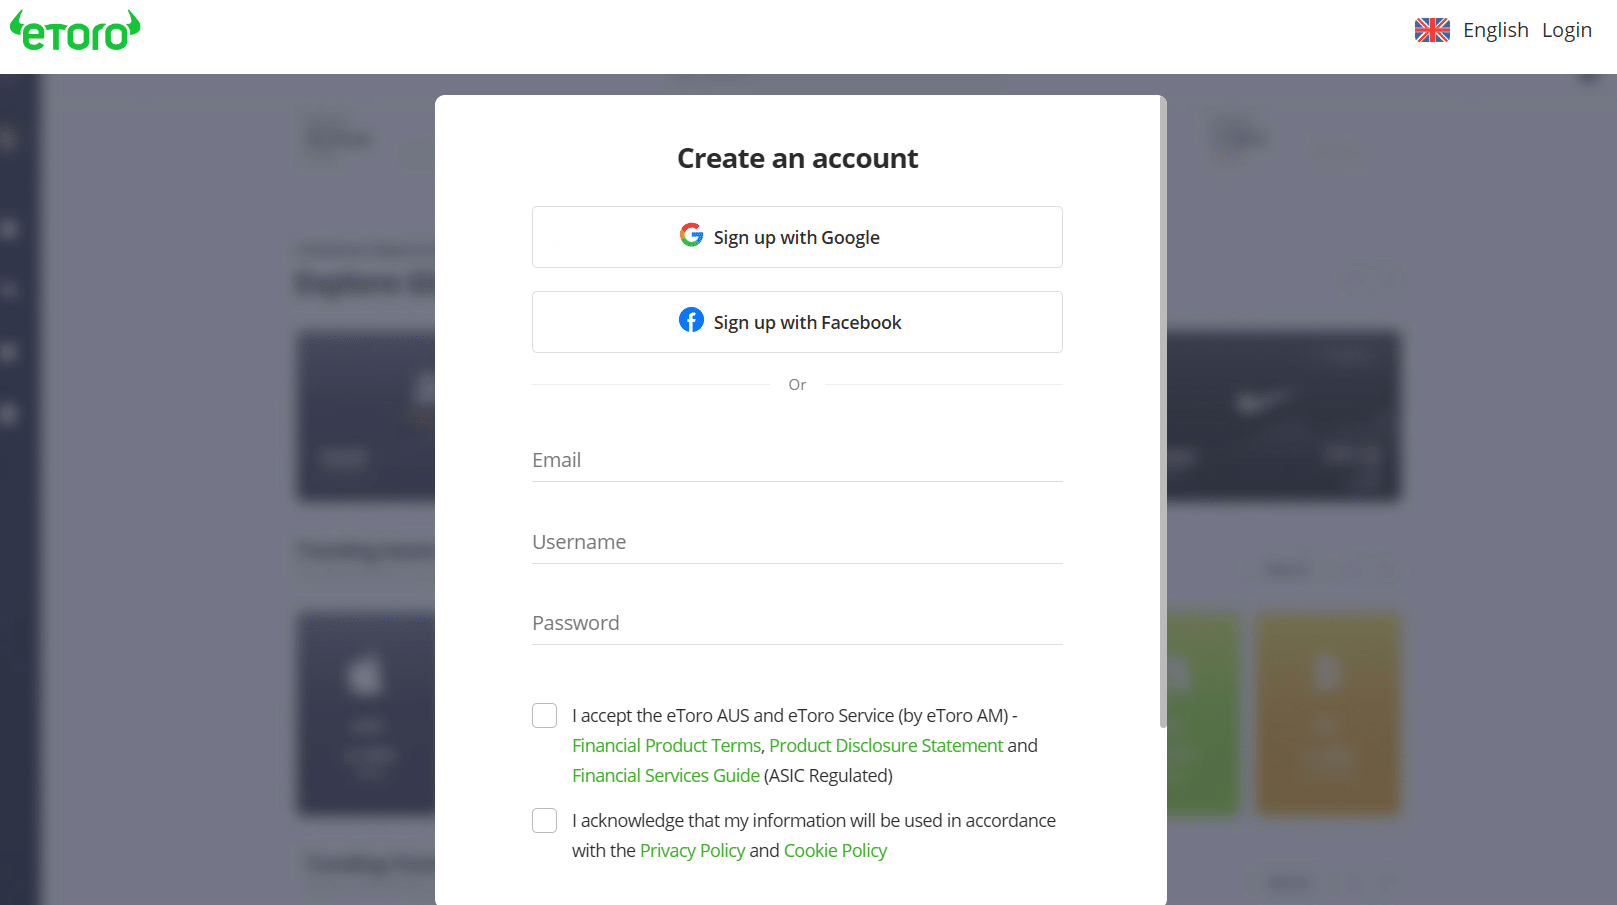
 Step 1: Open a new eToro account
Sign up for a new account by clicking “Join eToro” on its website. We’ve provided the official links on this page. Click “Visit eToro” on this page to open the official website.
Step 2: Verify your email and identityEnter your username, email address, and password. Receive the email verification code and input it to complete the first registration stage. You can trade with the virtual portfolio.
Step 3: Submit documentsSubmit your passport, driver’s license, and utility bills. These documents will verify your identity and address. Then, you can deposit and withdraw from your eToro account.
Step 4: Browse and start tradingGo to the home dashboard. Browse the supported markets and review their analysis. Start trading with the moving average indicator.
What are Moving Averages in Trading? – Conclusion
Moving averages in trading seem simple enough. However, MAs are lagging indicators. They shouldn’t be used as sole indicators for trading decisions.
We recommend using MAs with oscillators and relative strength index.
Visit eToro to add the RSI and MACD indicators for better trading signals.

Disclaimer: Don’t invest unless you’re prepared to lose all the money you invest. This is a high-risk investment and you should not expect to be protected if something goes wrong. Take 2 mins to learn more.
References
- https://finmasters.com/how-to-calculate-your-risk-profile/
- https://www.thebalancemoney.com/trading-sideways-definition-examples-making-money-3305900
- https://fortunly.com/articles/risk-management-in-trading/
- https://www.bloomberg.com/news/articles/2022-12-09/retail-traders-lose-350-billion-in-brutal-year-for-taking-risks
- https://www.foxbusiness.com/lifestyle/consumers-reported-losing-nearly-8-8-billion-scams-2022-ftc
FAQs
Which moving average is best for trading?
Moving averages between 5 and 10 are ideal for short-term trading. Those from 50 and above are ideal for long-term trading.
What does moving average tell you?
It reveals the overall market trend as it smooths out the price movement curve.
How do you use moving averages in trading?
You can use one or multiple moving averages in trading. Go to your chart and add as many as are ideal for trading decisions.
What are the 4 major moving averages?
The four major moving averages include the simple, weighted, exponential, and smoothed moving averages.

Jeremiah Awogboro

Jeremiah Awogboro
View all posts by Jeremiah AwogboroJeremiah Awogboro is an experienced content writer with over 8 years of experience. He has a qualified MBChB degree and a keen interest in the stock market and the finance industry. His background in the industry has provided him with valuable experience in this field. Awogboro is dedicated to assisting and reaching out to as many people as possible through his writing. In his spare time, he enjoys music, football, traveling, and reading.

eToro: Overall Best Stock App with 0% Commission
VISIT ETOROYour capital is at risk. Other fees apply. For more information, visit etoro.com/trading/fees.stockapps.com has no intention that any of the information it provides is used for illegal purposes. It is your own personal responsibility to make sure that all age and other relevant requirements are adhered to before registering with a trading, investing or betting operator. Contracts for Difference (“CFDs”) are leveraged products and carry a significant risk of loss to your capital. Please ensure you fully understand the risks and seek independent advice.By continuing to use this website you agree to our terms and conditions and privacy policy.
Trading is risky and you might lose part, or all your capital invested. Information provided is for informational and educational purposes only and does not represent any type of financial advice and/or investment recommendation.
Crypto promotions on this site do not comply with the UK Financial Promotions Regime and is not intended for UK consumers.
© stockapps.com All Rights Reserved 2026