Why Do Stocks Go Up and Down?

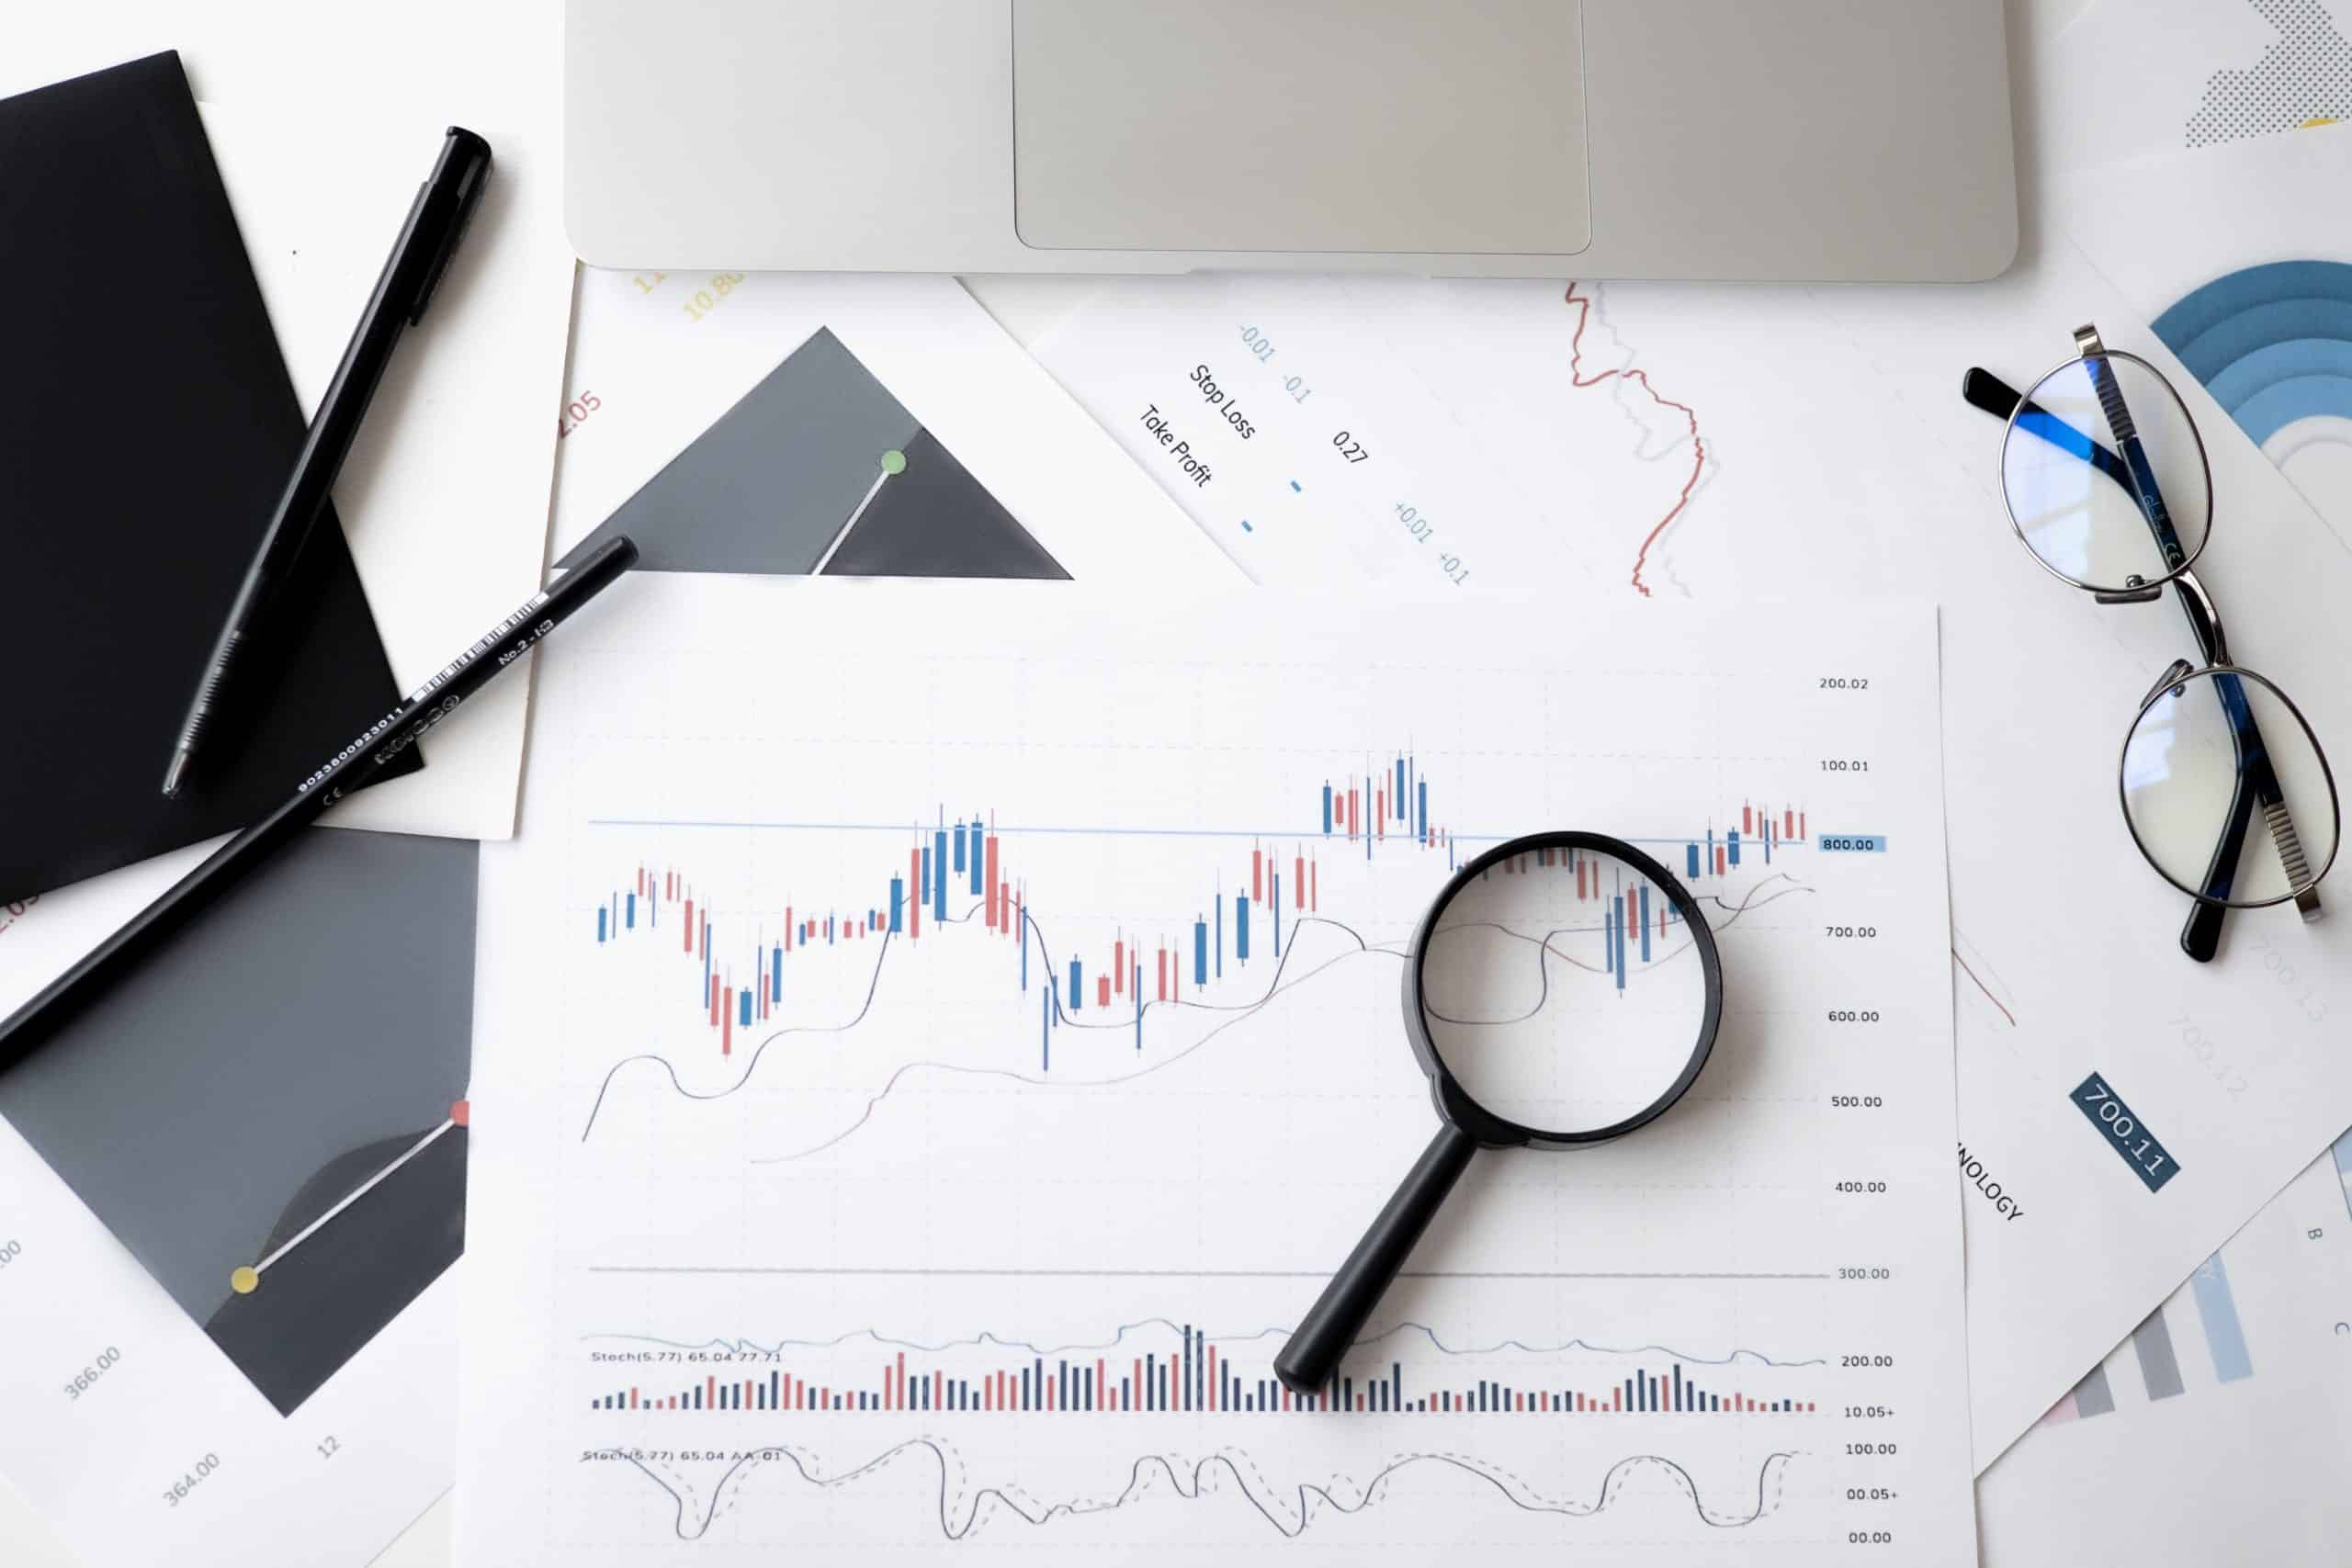
Waves and sometimes steep slopes and climbs characterize a typical stock price movement. As expected, knowing what makes a stock go up boosts your trading decisions. It is the foundation for becoming an experienced trader for short- or long-term investments.
Demand and supply are the prominent determinants of stock prices, causing the uncertain and unpredictable movements we see on charts. However, governments, politics, and natural events also affect price movements. While you can’t accommodate the vast amount of information in these areas, thorough research is recommended.
We’ll explore what makes stocks go up and down and how to trade around this knowledge. Information is crucial in making the most of trade, especially in volatile markets. With that in perspective, let’s begin with the foundation, supply and demand.
-
-
Supply and Demand Dynamics
Basic economics tells us that prices increase when demand outweighs supply. The same thing occurs in stock trading because we have buyers and sellers. Even long-term holders do so to sell at a higher price or to enjoy dividend payments.
Specific events can drive supply the same way they can drive demand. For example, appointing a new famous CEO can drive demand for a company’s stocks. Buyers may believe the new CEO will propel the company to new heights and raise its valuation soon.

This section will establish the role of buyers and sellers and why the stock market is going up or down. Then, we’ll review market orders and their correlation to stock prices.
The Role of Buyers and Sellers in the Market
Liquidity is essential for any company to maintain its capitalization and business operations. They might have stocks to sell but must find buyers willing to spend money. With cash flow, business operations move smoothly.
When learning to research stocks, liquidity, and a company’s financials are crucial. Buyers look for the best stocks, while sellers hope to lighten their portfolios. Both sections have different reasons for their actions.
Often, buyers see an upcoming bullish trend and move into open positions (buy stocks). Conversely, sellers may see an upcoming bear market and move in to close their positions. These meet on stock trading apps, whether for short- or long-term trades.
Stock prices will remain stable when the number of buyers matches the number of willing sellers. There is no motivation to increase or decrease the price. Moreover, you’d leave for an affordable option if one buyer decides to peg the stock above the market average.
Buyers and sellers create demand and supply. The latter controls stock prices, for the most part, in a healthy market.
Impact of Investor Sentiment on Demand
Investors often feel one way about a company in a specific period. For example, they will feel unmotivated to hold their positions in a company laden with scandals and possible bankruptcy. The same investors might open or reinforce their positions if the government announces a bailout for the affected company.
Investor sentiment refers to the overall mood of the market. Demand increases if they see the company in a positive light. More investors come in for an open position, gradually increasing the demand for the company’s stock.
As traders, you should be familiar with market sentiment indicators, including the following:
- Moving averages
- Bullish percent index
- High-low index
- Fear Index
These indicators can help you gauge market sentiment and forecast an impending upward or downward trend. Demand decreases as investors pull away from a company’s stock. Buyers find fewer sellers and may be forced to lower their prices to sell off their shares.
How Market Orders Affect Stock Prices
Again, the stock market boils down to buying and selling. Investors and traders do that through orders (order books). Market orders are primarily instructions to your broker to sell or buy a stock.
Understanding how market orders requires knowing the order types in the market. You can have buy or sell orders. A balance of both creates a sideways market with no significant price changes.
A market will head for a downtrend if sell orders exceed buy orders. That means fewer investors are willing to buy the stock, forcing traders to sell at lower prices. Conversely, having more buyers might be a signal for an uptrend.
The order book can be overwhelming. Most online brokers limit access to registered subscribers and traders.
Disclaimer: Your capital is at risk.
Market Efficiency and Information Flow
Stock prices in an efficient market reflect their true value. They represent the total information related to the stock and its trading. Yet, experience shows that some markets are less efficient.
Information flow is essential in an efficient market. Also, market prices only react to new information. This theory of what determines the price of a stock is contained in the efficient market hypothesis.
Our exploration of why stocks go up and down takes us to a controversial theory. It is controversial because the theory states that it is impossible to beat the market. However, Warren Buffet has proven time again to beat the market.
Efficient Market Hypothesis Explained
This theory postulates that stocks always trade at fair prices. As a result, you cannot buy undervalued stocks or inflate a stock’s value while selling. It becomes impossible to beat the market through market timing or expert stock selection.
The efficient market hypothesis (EFM) holds that the stock’s price already reflects all the available information. You can refer to the 1986 Challenger crash that caused Morton’s stocks to drop by more than 11%. Other companies involved in the project had 2% to 3% drops.
This movement was because the market soon figured that Morton Thiokol was the primary driver of the project.
Stock prices already reflect old information. New information remains unknown, making the stock market unpredictable.
How Information is Quickly Incorporated into Prices
New information affects stock prices. This can happen quickly or moderately (refer to the weak, semi-strong, and strong EFM forms). However, we have public and private information that can adjust prices.
Information incorporation is gradual. However, it is faster today, thanks to instant messaging technology. It takes an instant to see price movements in the stock market.
Private information might be incorporated faster than public information. This unfair advantage makes insider trading illegal in the United States and many countries.
News, Earnings Reports, and Their Immediate Impact
Positive news turns market sentiment in a stock’s favor. For example, launching a ground-breaking product can cause investors to open positions with a company’s stocks. They hope to profit as the company’s product gathers attention, generates sales, and increases the valuation.
Buyers who see the news early tend to enjoy purchasing stocks at the best price. Those who come in late might purchase at higher values as sellers increase their prices because of demand.
Long-term investors who earn dividends look out for earning reports. Even so, day traders can also use the information to their advantage.
A positive earnings report paints a company in a good light. It often results in an increased purchase of the company’s stocks. The reverse occurs if the company reports losses.
Most traders use stock alert services to get instant news about their portfolios. The faster you receive the information, the better positioned you’ll be to maximize it. Customize the software to send only news about stocks in your portfolio and preferred sectors.
Interest Rates and Monetary Policy
Central Banks control a country’s interest rates. They can raise or lower it in response to economic situations. While boosting the economy, interest rates can affect stock prices.

Monetary policies can encourage or discourage company growth. For example, devaluing a country’s currency can result in losses that reduce a company’s valuation. Buyers will bargain lower prices for the stock, causing the price to fall.
The Relationship Between Interest Rates and Stock Prices
Interest rates and stock prices have an inverse relationship (generally). Higher interest rates often result in lower stock prices. That happens because the company borrows less to fund its operations and maintain cash flow which affects its valuation.
Borrowing is the driving relationship between interest rates and stock prices. It Is among the things that make a stock go up or down. With interest rates, the Federal funds rates are the primary focus.
The Federal funds rate is what depository institutions use for overnight loans. These include banks, credit unions, credit, and loans, etc.
While rising interest rates make borrowing more challenging, banks and financial institutions enjoy the sweet end of the deal. Businesses in the financial sector tend to benefit from rising interest rates. Their company valuations may increase, causing their stocks to trade at higher prices.
Businesses in the financial sector can report higher earnings because of higher interest rates. Hence, what determines the price of a stock in the financial sector may work inversely in other sectors.
Central Bank Policies and Their Influence
We can divide Central Bank policies into two, as follows:
- Expansionary policies
- Contractionary policies
The table below shows how both approaches influence investments and the stock market:
Expansionary policies Contractionary policies These policies involve lowering short-term interest rates. Spending increases, causing stock prices to rally as buyers enter new positions. Investors may demand higher yields, resulting in lower prices. The national currency will receive a boost, but consumers tend to save more. That results in more sellers and fewer buyers, causing stock prices to fall. Yield Curve Inversions and Market Reactions
The market can react in several ways, including the following:
- Cautious trades after an inverted yield curve
- Shifts from riskier assets to less volatile ones
- Reduced spending
Economic Indicators and Corporate Performance
It takes keen observation to determine why stocks are going down. Charts and technical indicators rely on past price data without insights into what makes the stock go up or down. We’ve explored interest rates and monetary policies, leaving us with economic indicators.
A company’s performance can rally investor sentiment. Some buy back stocks to control market capitalization and cause positive price movements.
This section will explore several economic indicators and how to use them to determine stock price movements. You’ll also see how corporate performance rallies market expectations in a stock’s favor.
GDP Growth and Its Impact on Stocks
Investors look for healthy economies with promising returns. One way to predict an economy’s health is by looking at its GDP.
A country’s GDP grows as businesses, governments, and consumers spend more. That can stimulate corporate earnings, encouraging investors to open or reinforce their positions.
Businesses have more confidence to expand and pursue innovations. These moves ultimately court investors who foresee higher valuations soon. Then, they buy more stocks or continue holding their portfolio instead of selling.
We don’t recommend predicting the stock market of the GDP alone. Other factors that contribute include the following:
- Fiscal policies
- Investor confidence
- Sector-specific effects
Unemployment Rates and Consumer Spending Trends
High unemployment rates are never a good sign for the stock market. First, fewer people are willing to risk their resources by opening positions by buying new stocks. Unemployed people barely have income, more so, money for the stock market.
An economy with high unemployment rates has less consumer spending. Cash flow is limited, and investments slow down. Businesses find fewer and fewer patronage, which might result in closure.
Increasing consumer spending could mean higher profits for companies. While the spending might be unrelated to stocks, this trend is among what makes a stock go up. Investors with dividend stocks can earn more, while new investors open positions because of the company’s positive outlook.
Corporate Earnings Reports and Market Expectations
This parameter is simple to understand and relates to the stock market. We want to see our companies perform well. A corporate earnings report is a quick way to gauge a company’s annual or periodic performance.
Businesses with growing earnings leave investors with more confidence. That attracts more investors. However, fewer investors are willing to sell, resulting in higher stock prices.
Increasing stock prices may not necessarily result from higher corporate earnings. Investors (the market) might be hopeful of the company turning a profit soon. That often accompanies a disruptive event that can change a company’s fortune.
Analyzing market expectations is crucial to looking beyond stale corporate earnings. The latter shouldn’t push you away from investing.
Disclaimer: Your capital is at risk.
Market Cycles and Investor Behavior
Buyers won’t always demand more stocks. Similarly, sellers won’t always be willing to sell. These changes result in different market cycles that may repeat.
Wyckoff’s market cycle is one way to understand price movements. You can read that up in our extensive analysis of the Wyckoff method, its strengths, and weaknesses.
Bull and Bear Markets: Understanding Market Phases
Stock prices can go up, down, or sideways. The last pattern is often unfavorable for investments, short- or long-term. Hence, we boil down to up or down movements.
These up-and-down movements result in bull or bear markets. The former represents when sentiment is strong and more investors enter open positions.
Bull markets are identified by continuous upward price trends. Slight fluctuations may occur, but the general trend is upward.
Conversely, bear markets are identified by continuous downward price trends. This phase might accompany a bull market immediately or have a sideways market in between.
The bull and bear market phases represent different trading opportunities. For example, entering a short-term trade during a bull market is a recipe for a loss. The stock might hit resistance levels soon and move sideways or even enter a bear market. Refer to our article on chart patterns to identify several shapes during price movements.
Opening positions at the start of a bull market is best. Conversely, closing positions at the start of a bear market saves you from losses. You can use take-profits and stop-loss functions to automate your exit position.
Investor Psychology and Emotional Factors
Some investors prefer short-term, volatile trading conditions. Others prefer less volatile, long-term trades. These are different investor psychologies that require unique trading approaches.
Risk tolerance is also part of investor psychology. This determines how much you are willing to invest and which markets (volatile or less volatile) you prefer.
Avoid buying stocks for fear of missing out. FOMO is a typical investor psychology that leads to irrational purchases. It removes logical stock research, resulting in investors driven by emotions.
Typical emotional factors in stock trading include the following:
- Overconfidence
- Regret aversion
- Maintaining the status quo
- Loss aversion
A celebrity’s endorsement can drive emotions for a company. That could cause fans to invest in the company’s stocks, causing the price to increase as demand outweighs supply.
Impact of Recessionary and Expansionary Periods
Businesses report losses during a recession. During this period, sellers have challenges finding buyers for their stocks. Investor confidence is often low, with most investors avoiding short-term trades.
The reverse is the case during expansionary periods. Buyers rally as the market opens with new opportunities. You’ll find promising uptrends during this period.
Earnings and Revenue Performance
We’ve mentioned earnings several times as an essential component of what makes a stock go up or down. It is not only essential to dividend stock investors but also to short-term traders. Hence, we must review it for thorough research.
Corporate earnings fall under alternative data, and you might need separate services to get these details. We love to invest in businesses that turn a profit. However, that profit should grow year in and year out.
The Significance of Earnings Releases
Dividend stock investors are the keenest on earnings releases from their companies. To them, it promises the next payment and the possibility of an increase. Nonetheless, many others look forward to new investment opportunities from companies with a positive outlook.
The significance of earnings releases includes the following:
- Investors can track a company’s performance over time by comparing several quarterly earnings. An increase will paint a positive picture and raise the enthusiasm for more investments.
- These reports show transparency, boosting trust among long-term investors. Short-term traders can also review their releases and gain the confidence to open new positions.
- It saves time that would’ve otherwise been used for thorough research on a company’s financial standings.
Revenue Growth and Market Perception
Three things will likely happen with earnings releases over time. The company can show progress (increased earnings), stagnancy (hovering around the same amount), or loss. We look for the former when sourcing new investment opportunities.
Increased earnings over time are an encouragement to open or reinforce your trading positions. The market will perceive that the progress may continue, especially when the company faces less competition.
Losses may not necessarily damage a company’s reputation, especially for startups. We know these businesses fly on debt as they maximize growth over profits. However, the case differs for blue-chip stocks, where the parent companies are industry leaders.

Revenue growth in large-cap companies signifies stability. The market begins perceiving that the company has enough to weather economic downturns. Hence, they use the company’s stocks to hedge against the volatile market.
Earnings Guidance and Market Expectations
Revenue reports show a company’s after-tax income. Here’s a brief guide to using them as investment cues:
- Understand what earnings represent
- Compare the reports with the earnings per share
- Mark the release periods for companies in your portfolio
Publicly traded companies in the United States release earnings four times a year. This approach leaves expectations behind as the market earnestly rallies for trades.
Management Decisions and Corporate Actions
Corporate leadership is essential in stock trading. We don’t buy stocks because a company’s CEO says so. Instead, we do that when the leadership implements reliable growth policies.
Internal and external policies can affect the stock market. For example, a new employment policy on overseas staff can boost market sentiment and bring a perception of expansion.
This section will explore the following:
- How leadership changes affect stock prices
- How dividend and buyback policies influence the market
- How mergers and acquisitions influence market perceptions
Impact of Leadership Changes on Stock Prices
The Chief Executive Officer is often the highlight of company leadership. Hence, news about the office tends to influence the stock market. Here are a few ways leadership changes impact stock prices:
- CEO changes can result in a volatile stock price
- Abrupt changes may cause investors to close positions against impending losses
- A new leader with significant achievements can boost investor confidence, rallying the stock’s price
Dividends, Buybacks, and Their Influence
Investors are more likely to opt for companies that announce dividend payments. Such news often indicates stability and growth.
Buyback programs produce positive market sentiment. It shows that a company has enough cash reserves. It concentrates company ownership among fewer shareholders, rallying the stock price.
Mergers, Acquisitions, and Market Reactions
Acquirers and target companies face different market reactions after an acquisition. Mergers often produce a volatile market as investors wait for the uncertainties to die down. The table below shows how the market reacts to acquisitions:
Acquirers Target Companies The stock price may fall as the company often uses its cash reserve or debt to finance the purchase. The stock price will increase because the acquirer must pay a premium to satisfy the company’s shareholders. Industry Trends and Competitive Landscape
Competition and disruptive technologies make a stock go up or down. Hence, be watchful and keep up with reliable news platforms.
Sector-Specific Influences on Stock Prices
A new smartphone camera technology or the recent titanium frames from Samsung or Apple do not affect businesses in healthcare. The new technology might cause investors to rally around a company with an expected boost in sales. Buyers gradually begin outnumbering sellers, causing stock prices to increase.
Technological Disruptions and Innovation Impact
Startups often gain public admiration quickly because of their disruptive nature. WeWork is a significant example, although its concept may have failed. Public companies share a similar reaction when they come up with new, disruptive technologies.
Stock prices increase as long as the technology remains proprietary to the company. They decrease when other companies buy in with competitive variations.
Evaluating Market Positioning and Competition
Companies that position themselves with significant value enjoy more customer loyalty. In today’s world, where it takes little time for a company to replicate another’s innovation, market perception is essential.
Disclaimer: Your capital is at risk.
Geopolitical Events and Global Uncertainty
Impact of Political Tensions on Markets
The following are ways political tensions impact the market:
- Knee-jerk reactions, like price drops due to geographical conflicts
- Stock prices can rise after the election of a business-friendly candidate
Learn to tune out noise and focus on events that truly matter in the political atmosphere.
Global Economic Events and Market Volatility
Economic events include trade disputes, civil unrest, mass protests, and black swan events. These bring uncertainty that causes investors to be more cautious. They tend to risk less, reducing trading volume that can result in price declines.
Trade Wars, Sanctions, and Market Repercussions
Sanctions and trade wars cause the following repercussions:
- Uncertainty
- Volatile commodity prices
- Technology lag
- Weak global economy that affects corporate profits
Natural Disasters and Pandemics
Market Responses to Natural Calamities
Natural disasters can result in full business closures. With operations shut off, cash flow begins to decline. While large-cap businesses can rebound quickly, small-cap businesses often fall into debt to resume operations.
Investors are cautious during natural calamities. They may sell off their shares, resulting in a price decline.
The COVID-19 Pandemic and Market Dynamics
COVID-19 is a prime example of how pandemics affect the stock market. The same goes for natural disasters like tsunamis, earthquakes, and hurricanes.
The S&P 500 fell by 34% between February and March 2020. Natural disasters and pandemics can lead to business closures. With that comes a decline in the stock trading volume.
Mitigating Risks in the Face of Unforeseen Events
Invest in blue-chip stocks to mitigate risks. Also, hold off on buying new stocks until the events play out or stability returns.
The best approach is to be cautious. Research stocks and stick with companies with enough financials to weather the storm.
Market Manipulation and Regulatory Changes
Recognizing Signs of Market Manipulation
The following are signs of market manipulation:
- The spread of misinformation about a company or stock
- Abnormal trading volumes without clear reasons
- Abnormal scarcity after whale purchases
- Rapid price fluctuations
Regulatory Changes and Their Immediate Impact
Governments and the SEC could issue new regulations at any time, especially if you don’t keep up with trending news. These changes can affect investor behavior, liquidity, and trading dynamics. An example is announcing new tenures for bank executives.
The Role of Market Safeguards and Circuit Breakers
Financial regulators install safeguards and circuit breakers to maintain stability. They use thresholds to trigger these safeguards automatically. The roles of the safeguards include the following:
- Trading halts when the market declines below a threshold.
- Market closures
- Set price bands above and below the average stock price
Recap of Key Factors Driving Stock Price Movements
The key factors driving stock price movements include the following:
- Supply and demand
- Interest rates and CBN monetary policies
- Corporate performance through earnings reports
- Corporate actions like mergers, share buybacks, acquisitions, etc.
- Technological disruptions and industry trends
- Natural disasters
- Pandemics
- Global economic events
Why Do Stocks Go Up and Down? – eToro Complete Guide
Dealing with stock price movements requires a robust trading platform. eToro tops our recommendations with easy-to-use features and a user-friendly interface. It also offers a $100,000 virtual trading account.
Follow the steps below to open an eToro account:

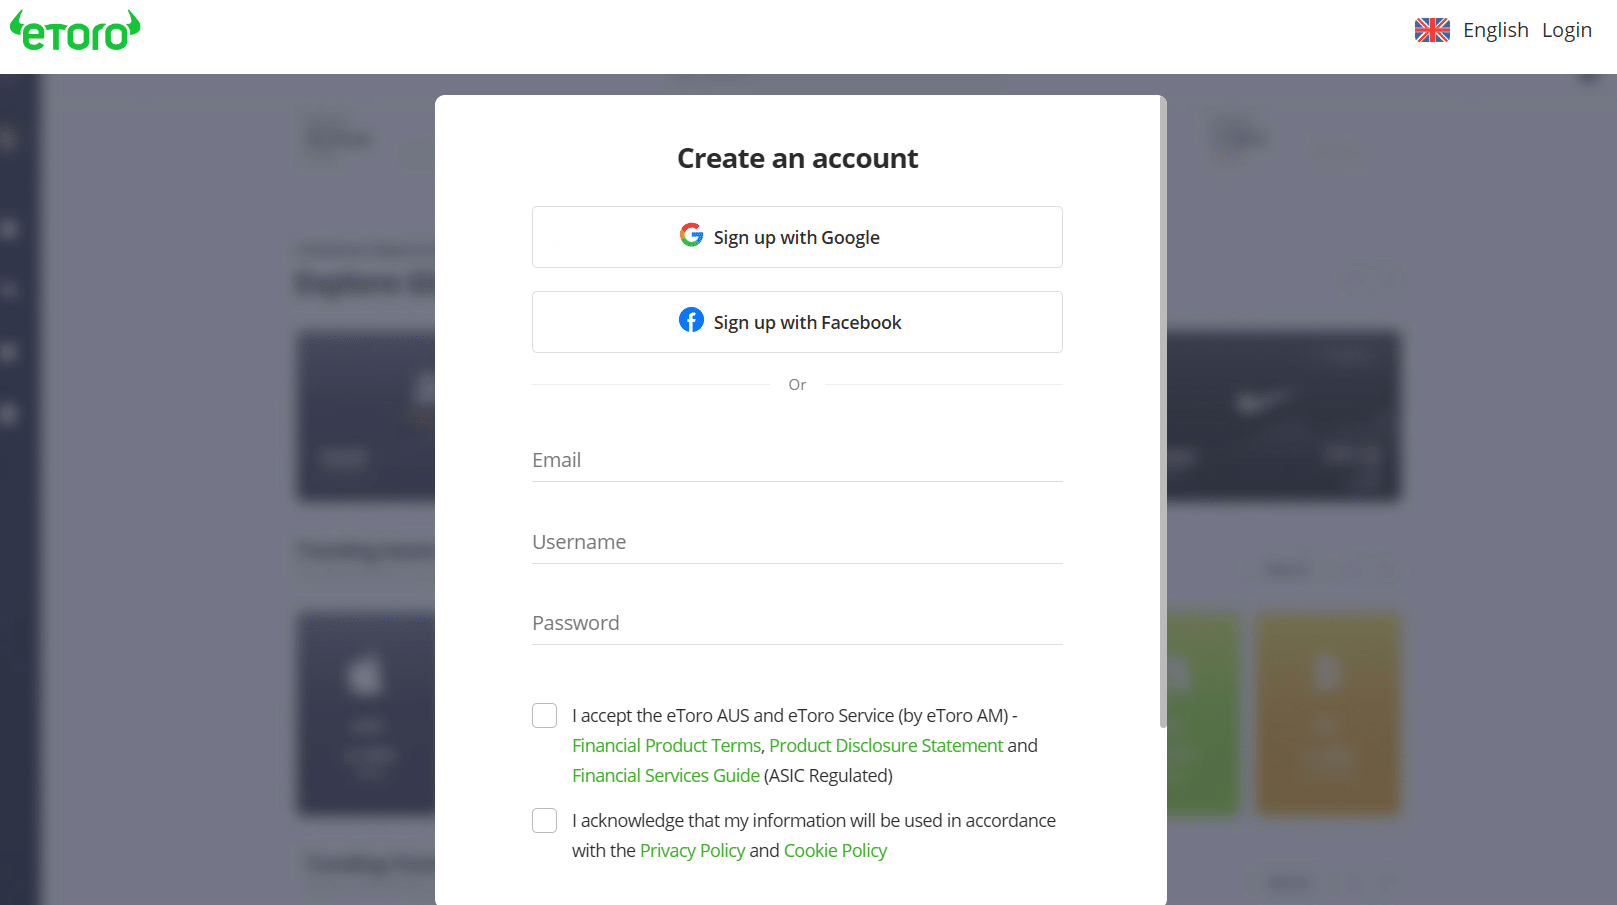
For illustration purposes only
Step 1: Visit the eToro website or its mobile appUse our links to open the official and secure eToro website. You can do that on your PC or mobile device. Smartphone users (Android and iOS) can download the mobile application from the homepage links.
Step 2: Join eToroThe next step is opening the registration page. Use the links on the homepage of the website or the mobile app to open the page on your device. Click “Join eToro” or “Join Now.”
Step 3: Fill out the formUse Google to fill out your details quickly. Alternatively, you can fill them out manually. Enter your username, email, and password.
Step 4: Verify your emailClick “Complete registration” to close the registration page. Go to your email and copy the verification code. Paste it on the verification page to complete the registration.
Step 5: Log into your dashboardLog into your new eToro account. Scroll down and switch to the virtual account to practice with $100,000. Otherwise, fund your account and start trading.
Conclusion
The stock market passes through uptrends, downtrends, and sideways trends. Knowing what makes a stock go up or down will spare you from panic investments or trades. The best approach is to research your stocks thoroughly before selling or buying.
Disclaimer: Your capital is at risk.
References
- https://www.space.com/31732-space-shuttle-challenger-disaster-explained-infographic.html
- https://vanelswyklaw.com/understanding-insider-trading-why-its-illegal-and-how-its-detected/
- https://stacker.com/business-economy/20-famous-events-tanked-companies-stock-prices
- https://www.nytimes.com/2022/02/22/business/russia-ukraine-stock-markets.html
- https://www.forbes.com/sites/theyec/2023/02/10/the-aftermath-and-impact-of-covid-19-on-stock-markets/?sh=1b782026c120
FAQs
Why do stocks keep going up and down?
They go up and down in response to demand and supply dynamics. The latter can be influenced by several factors, including interest rates, monetary policies, economic indicators, etc.
What makes your stock price go up and down?
Your stock price goes up when demand outweighs supply. It decreases when supply outweighs demand.
Why am I losing money when the stock is going up?
You would lose money with a rising stock price if you made a call option. Your trade only profits if the stock price decreases.
What goes up when stocks go down?
Treasury bonds, gold, cash, inverse EFTs, etc. are assets that go up when stocks go down.
Who keeps the money when a stock goes down?
The money doesn’t go to anybody, neither the broker nor the company. Instead, stock prices reflect the market dynamics.

Jeremiah Awogboro

Jeremiah Awogboro
View all posts by Jeremiah AwogboroJeremiah Awogboro is an experienced content writer with over 8 years of experience. He has a qualified MBChB degree and a keen interest in the stock market and the finance industry. His background in the industry has provided him with valuable experience in this field. Awogboro is dedicated to assisting and reaching out to as many people as possible through his writing. In his spare time, he enjoys music, football, traveling, and reading.
stockapps.com has no intention that any of the information it provides is used for illegal purposes. It is your own personal responsibility to make sure that all age and other relevant requirements are adhered to before registering with a trading, investing or betting operator. Contracts for Difference (“CFDs”) are leveraged products and carry a significant risk of loss to your capital. Please ensure you fully understand the risks and seek independent advice.By continuing to use this website you agree to our terms and conditions and privacy policy.
Trading is risky and you might lose part, or all your capital invested. Information provided is for informational and educational purposes only and does not represent any type of financial advice and/or investment recommendation.
Crypto promotions on this site do not comply with the UK Financial Promotions Regime and is not intended for UK consumers.
© stockapps.com All Rights Reserved 2026
We use cookies to ensure that we give you the best experience on our website. If you continue to use this site we will assume that you are happy with it.Scroll Up