What Is Beta in Stocks? – How to Calculate Beta and More

Some stocks and financial instruments are more volatile than others, carrying more investment risk. Looking at the price fluctuations over a long period of time will give you an idea of a stock’s volatility. With Beta in stocks, you have a more overall view of the stock’s volatility compared to the market.
You don’t need much technical knowledge to calculate stocks beta to guide investment decisions and portfolio creation. However, you will need a basic understanding of reading charts and adding technical indicators like moving averages. It’s time to step up your investment strategy, and the stocks beta is a crucial component.
This article will answer the question, What is beta in stocks? You’ll learn about its significance, how to calculate it, and how to use it in portfolio construction. We’ll also recommend a trading platform to get a demo account and practice the ideal strategy.
-
-
What is Beta?
As time passes, stocks frequently experience gains and losses in value due to various factors, including alternative data like sentiments. The best investment approach is to compare the stock to the overall market. With that, several questions will pop up, like, does it move with the market, or is it more volatile than the market?
Beta (β) is a vital capital asset pricing model (CAPM) metric. The latter relates a stock’s volatility with the expected returns, allowing investors to predict the return on investment. This approach considers the risk of trading the stock and the capital.
We’ll answer the question (What is beta in stocks?) and explain its significance. With that in mind, let’s begin with the definition.
Definition and explanation of beta as a measure of a stock’s volatility
Beta is a measure of a stock’s volatility compared to the market. That means the degree to which the price fluctuates compared to the broader market containing several financial instruments. The S&P 500 is the most prominent market index for evaluating stocks beta.
Many platforms, including day trading apps and price checkers, provide charts that show a stock’s price movement over time. You’ll notice up-and-down trends as the stock increases and declines. The same direction applies to the overall market when the average is applied.
Market averages add up the prices in an index and divide it by the number of asset units. If you overlay a stock’s price movement with the market average, you’ll notice similarities or differences. The stock’s price can follow the market average closely or loosely, or move oppositely to the market average.
Essentially, beta in stocks shows how closely related or widely differentiated a stock’s price fluctuation is to the market. This measure is identified with a figure for easy comprehension. Here’s how to interpret the beta metric:
- A beta of one: This shows that the stock’s price perfectly syncs with the market. If the market gains or loses by 1%, the stock’s price follows suit by 1%. That does not mean the stock and the market have the same prices.
- Greater than one: This shows a more sensitive stock than the market. If the market gains or loses by 1%, the stock’s price follows suit by a higher percentage (maybe 1.5%). Expect more significant gains and losses in the stock than the index average.
- Less than one: This indicates a less sensitive stock. If the market gains or loses by 1%, the stock’s price follows suit with a lesser percentage, say 0.5%.
Why beta is a useful metric for investors in assessing risk
Some financial instruments do not correlate with the market. Cash is an ideal example that is unaffected by index movements. Furthermore, some assets have a negative beta.
Gold is an ideal example of an asset with a negative beta. Its relationship with the market is inverse, meaning it increases when the market declines and vice versa.
Put options trading is another example of negative beta. You must consider them when trading, unlike stocks.
High-beta stocks (greater than one) have the potential for higher returns. However, they carry a higher risk as they are more volatile. The same volatility that gives higher returns can cause more losses on the other end.
Low-beta stocks (less than one) have the potential for lower returns. However, you’ll deal with less risk when trading them. The losses will be lower compared to the market average.
Beta should be part of your overall approach to trading stocks. However, it should not be the sole determinant for buying or selling stocks.
Your capital is at risk
The Significance of Beta
Answering the question, (What is beta in stocks?) will be incomplete without evaluating its significance. Beta plays a crucial role in portfolio diversification and risk management.
The easy, quantifiable measure beta provides is helpful even to beginners. If you just learned how stocks work, you’ll find this metric simple enough to use in your evaluations.
How beta relates to the broader stock market and benchmark indices
Beta in stocks is a comparison between stock prices and the broader market. The comparison often uses benchmark indices, the most prominent being the S&P 500.
With this metric, you can use broader market research to assess the risk of buying, selling, or holding a stock. That is a safer approach than looking at the asset individually. We’ll see how to calculate beta using the broader stock market and benchmark indices.
The role of beta in portfolio diversification and risk management
Portfolio diversification is clever as it spreads your risk across different assets. You can add stocks from more volatile sectors and balance them with low-volatile options. However, you must first determine which stocks have more risk and which have less.

Beta comes with its own metric, defining how much risk a stock has compared to the broader market. This knowledge can help you decide which stocks to add to your portfolio. Of course, you want a balance of high-risk and low-risk assets.
Besides functioning independently, beta is a crucial component in the capital asset pricing model (CAPM). The latter shows the relationship between the risk of investing in an asset and the expected return. Its calculations use the risk-free rate, market premium, and beta.
For risk management, you can add high-beta stocks when the market shows positive growth. Conversely, you can opt for low-beta stocks when the market shows negative trends. There is a need for adequate stock market research and analysis to gauge market sentiment.
Portfolio diversification can be an ongoing process. That means you may need to sell some stocks and add new ones. Each time you want to refresh your portfolio, the beta will be essential to which stocks are sold and bought.
Beta Calculation
Most trading platforms will indicate stocks beta values. That makes things easier, especially if you need it for a quick evaluation. Notwithstanding, there is a formula to calculate beta for any given stock, provided you have the reference or benchmark index data.
You can use an Excel sheet for this calculation, as it has built-in functions for covariance and variance.
Explanation of the mathematical formula used to calculate beta
Regression analysis is used to calculate beta and assess a stock’s tendency to respond to market fluctuations. The formula is as follows:
Beta = covariance/variance
The covariance occurs between the stock’s return and the market return. On the other hand, the variance applies only to the market return. This formula is used over a specific period.
A positive covariance shows that the stock and market returns move together. Conversely, a negative covariance shows that the stock and market returns move inversely.
We recommend looking up the value on trading platforms or chart platforms like Yahoo. These platforms often use monthly returns over specific years to calculate stocks beta.
You can use portfolio trackers to monitor stock betas. With fluctuating market conditions, you must keep your assets under close watch.
How historical price data is used to estimate a stock’s beta
Covariance and variance in the beta formula refer to returns. The only way to know these returns is by analyzing historical price data. Hence, historical price data is essential in estimating a stock’s beta.
Past events can give insights into a stock’s future trajectory. It is among the parameters AI stock-picking services use to determine potential high-performing stocks. Notwithstanding, other factors influence a stock’s future course.
Interpreting Beta Values
We touched sparingly on interpretation when answering the question (What is beta in stocks?) at the beginning of this article. You can look at the beta and decide if a stock is worth investing in. Of course, you’ll need to consider other factors.
Besides predicting a stock’s volatility, the beta can also offer insights into a stock’s historical price movements. The question (What is beta in stocks?) is worth asking, as the parameter is simple but insightful. Here are our thoughts on the interpretation and insights on stocks beta.
Interpreting beta values: above 1, below 1, and negative betas
A beta of one means the asset perfectly syncs with the broader market. You’ll notice many similarities if you overlay the asset’s price movement with the overall market average. The asset falls when the market falls and gains when the market gains in the same proportion.
If the market looks good, stocks with a beta of one would be the most prudent choice. You’ll have more stability as they swing or respond as the market responds. However, they offer little profit in the short term if the market doesn’t vary much or remains relatively stable.
- Less than one: Let’s assume a stock has a beta of 0.5, and the market gains by 20%. The stock’s gain will be 10%. Investing in these stocks can be frustrating when the market gains massively, as you’ll see little profit compared to the market. However, the advantage of having a stock with 0.5β comes when the market falls. You’ll have fewer losses than the broader market. For example, a 20% market drop will have a 10% drop in the stock.
- Greater than one: Stocks with more than one beta are more volatile than the market. There are excellent assets in bullish markets, as they bring higher returns than the market. Conversely, you’ll lose more with them than with the market in bearish seasons.
- Negative beta stocks: Assets can have a beta of less than zero. In such cases, they perform the opposite of the market or index. They’ll gain when the market loses or lose when the market gains. ETFs are famous for their negative beta.
What is beta in stocks? The primary thing is knowing what the values represent and how to apply them in your investment apps for the short or long term.
Understanding what a stock’s beta reveals about its historical price movements
When used right, there’s much information you can derive by looking at a stock’s beta. Historical price movements are one of them. Although you’ll need charts to have specific prices, you can gauge the stock’s performance in the past.

An investor considering purchasing a particular stock may want to know whether it moves up or down just as quickly as the stock market in general.
Beta values above one signify stocks that have outperformed the market in past bullish seasons. Those with values below one represent stocks that have underperformed the market in bullish seasons. Hence, you can look at a market’s movement within a specific period and know how an asset performs.
Using Beta for Portfolio Construction
While we’ve extensively answered the question, (What is beta in stocks?), the real value comes in portfolio construction. By identifying highly volatile stocks and comparing them with your risk tolerance, you can determine which assets to add to your portfolio. The best approach is to have a balance of high- and low-volatility assets.
How beta can help investors construct portfolios with varying levels of risk
Your portfolio doesn’t need to stay fixed throughout your investment lifetime. They will change as you add or remove assets. That is necessary to respond adequately to market conditions and the economic outlook.
The first step to constructing your portfolio is picking an index that represents the broader market more adequately. Popular US stock market indices include the following:
- The S&P 500 (SPX)
- Dow Jones Industrial Average (DJI)
- Nasdaq 100 (NDX)
- Russell 2000 (RUT)
We recommend the S&P 500, as it more accurately represents the market. Once you’ve picked the benchmark index, the next step is to research stocks based on beta values compared to the index.
You should start with stocks with beta values of 1.0. That should give you the foundation to explore other volatile assets.
Add stocks with beta values above one if the season looks bullish and you want more action. However, these assets require close monitoring to avoid considerable losses if the market declines.
You can play with negative beta stocks. However, those are even more unpredictable than those with beta values above one. You can’t always trust that they will act in the opposite direction from the market movement.
Don’t rely heavily on beta. Yes, we have shown (What is beta in stocks?) how crucial this metric is. However, add other metrics to build your portfolio, among which alternative data is prominent.

Your capital is at risk
Balancing high-beta and low-beta stocks in a diversified portfolio
Beta can help diversify your portfolio. High-beta stocks carry more risk, while low-beta stocks have lower risk. Both are useful for different periods.
Low-beta stocks fare well during recessions and periods of high interest rates. They are not ideal for bullish seasons, as they drag your profits down. For the latter, high-beta stocks are the better picks.
Periods of economic expansion are ideal for investing in high-beta stocks. They’ll bring better returns than the market.
Keep both high-beta and low-beta stocks in your portfolio. The key comes from allocating funds to them. Allocate funds according to market conditions.
You can spend more on high-beta stocks during bullish seasons. Conversely, you can spend more on low-beta stocks during bearish seasons.
The initial question (What is beta in stocks?) focuses on stocks. However, you can use this metric for other assets.
Beta and Asset Allocation
Bonds, ETFs, and cash are other assets you can purchase for your investment. Beta can also help identify potential high-performing stocks for your portfolio. Let’s see how it plays this role.
The role of beta in asset allocation strategies (e.g., stocks, bonds, and cash)
Cash has no relationship with beta. Hence, it is unaffected by market or index movements. However, cash can be an essential asset, like credit cards.
Bonds have beta values like stocks. They are divided into positive-beta and negative-beta bonds. However, their reference or benchmark is not an index but interest rates.
Interest rates and bonds can have a parallel or inverse relationship, depending on the beta value. Inflation rates also affect bonds.
Use beta to determine which assets can bring higher returns under specific market conditions. Then, purchase them when those conditions set in or approach.
Using beta to assess the risk and return potential of different asset classes
What is beta in stocks, if not about risk? The whole idea of turning to this metric is to assess an asset’s risk. This risk invariably determines how much return you can expect from the investment.
High-beta assets carry a lot of risk. As seen earlier, they are ideal for certain market conditions and shouldn’t be used in bearish seasons.

Use the beta to find high-risk asset classes when the bullish season comes. The table below shows how to use beta to determine your assets based on market conditions:
Beta score Bullish seasons Bearish seasons High-beta stocks Ideal for bullish seasons Don’t invest in them during bearish seasons Low-beta stocks Not suitable for bullish seasons because of lower returns Invest in them during bearish seasons Limitations of Beta
What is beta in stocks? Should you rely solely on it? The answer to the second question is no. You shouldn’t rely exclusively on beta, as it is limited.
Other factors can influence a stock and cause it to behave in a way opposite to what the beta shows. We’ll see the primary limitations of beta and why you shouldn’t place your investment decisions entirely on them.
Discussing the limitations and shortcomings of using beta as a sole risk measure
Beta in stocks can help you assess and manage risk during investments. However, its reliance on previous market data leaves the future wide open.
Companies with poor stock beta can turn around and deliver high returns. We can also say the same thing about companies with excellent stock beta.
By relying on past returns, Beta misses out on possible events that can influence the market. That is why modern analysis platforms use AI to scout alternative data when predicting which stocks will perform well.
You can’t use beta to evaluate new publicly listed companies. These organizations have no previous returns to rely on. Hence, you can’t predict if their stocks are high- or low-risk.
Factors that may influence a stock’s beta beyond market risk
Our answer to the question (What is beta in stocks?) will be incomplete without exploring other factors influencing stocks. These factors include the following:
- Earnings and profitability: A company’s stock price has the potential to rise if it reports high earnings. Profit margins are closely monitored metrics.
- Debt: The more debt a company has, the less confidence it gives investors. Hence, people are less likely to buy its stocks, even with a high beta.
- Dividends: Companies that regularly pay dividends encourage more investments.
Your capital is at risk
Other Risk Measures
What is beta in stocks compared to other metrics? Beta is popular for risk assessment. Nevertheless, investors have other measures they use to determine risk.
Introduction to alternative risk measures like alpha, standard deviation, and R-squared
A few alternative risk measures to beta include the following:
- Alpha: This metric gauges a stock’s performance compared to the overall benchmark index. It uses a number to represent the percentage at which the stock outperformed or underperformed the benchmark.
- Standard deviation: This metric determines how asset prices spread from their average. It is high for stocks that swing significantly, indicating high volatility. The reverse is true for stocks that swing less.
- R-squared: This metric identifies the proportion of variance in the stock prices compared to the benchmark index. It involves determining how much index movement can account for the stock price movement. Even so, it is less used than other risk measures.
Considering multiple risk metrics for a comprehensive risk assessment
We’ve established the importance of beta while answering the question, (What is beta in stocks?” It is a crucial metric for risk assessment. A glance can tell you if a stock is high- or low-risk and help you plan your portfolio management strategy.
While beta measures volatility, it is not conclusive for a comprehensive risk assessment. The previous section introduced a few metrics to help you have a more holistic view of the stock’s tendencies. These include alpha, r-squared, and standard deviation.
You should combine these metrics for risk assessment. You can use two at a time or pick the entire squad for more in-depth analysis.
While most platforms do the calculations and provide numbers, being an expert helps. You should learn to read and interpret charts like candlestick charts, price charts, etc.
Have adequate knowledge of the benchmark index. Whether you go with the S&P 500 or the Dow Jones Industrial Average, ensure you understand how that market works. That will help you apply the risk metrics better.
What Is Beta in Stocks? – eToro Complete Guide
What you’ve learned today is enough to give you a starting point for making trading decisions with Beta. Fortunately, most platforms include this value in their stock analysis. eToro is prominent, offering a demo account to get you started
Ensure you have an active email before setting up your account. You can do it on your smartphone if you don’t have access to a PC immediately. Also, the registration process is quick and the interface is easy to understand
Here’s a complete guide to trading on eToro:
Step 1: Follow our link to the official eToro websiteClick any of the eToro links provided on this page to open the official website. Ensure you are on the homepage. Click the “Join eToro” button on the home page.
If you mistakenly click the login button, you can always switch to “Create an account.” The registration page will open with sections to fill out your details.
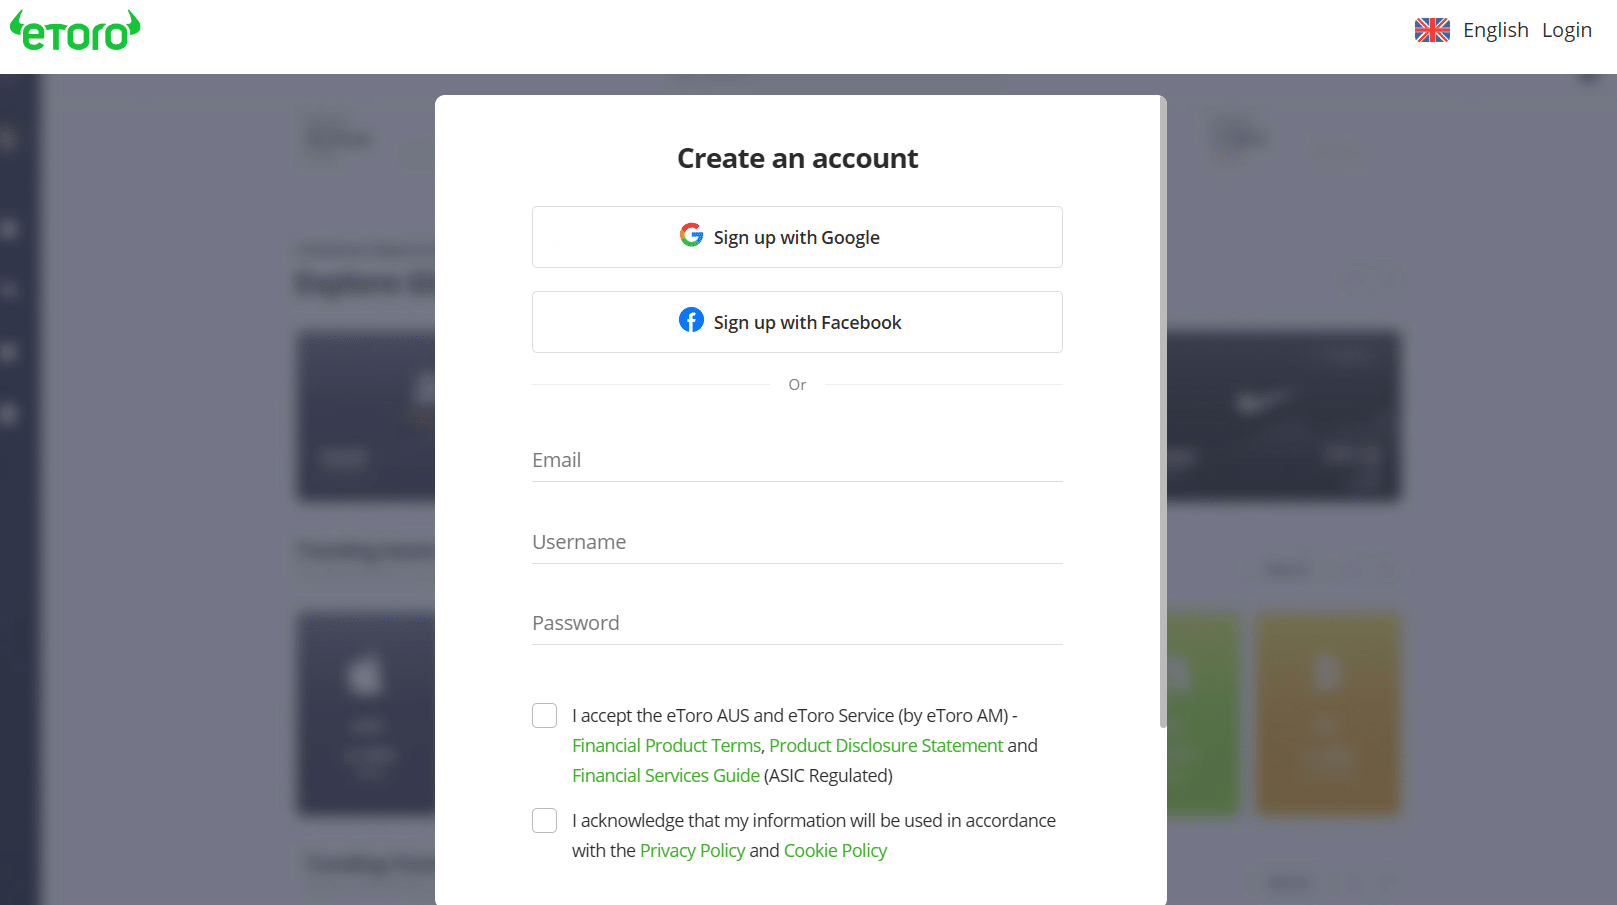
Step 2: Provide your detailsLike on other platforms for finding beta in stocks, eToro will request your details. This preliminary stage only requires a few details to get you started. Fill out the sections for email, username, and password.
Accept the terms and conditions and consent to the privacy policy. Click “Create account” to complete the registration process.
Step 3: Log in to verify your accountLog into your eToro account and go to your profile page. You can complete your bio, which will show as you upload it to the social section, showing posts from other traders. To verify your eToro account, upload the following documents:
- Proof of your identity (IDs and driver’s license or passport)
- Proof of residential address (utility bill)
- Verify your phone number by asking eToro to send an SMS
Step 4: Deposit FundsThe most crucial step in trading is funding your account. Otherwise, you will be limited to the demo account. Open the side menu and click “Deposit.”
Enter the amount and your card details. Ensure the credit or debit details match your eToro account details.
Step 5: Start tradingGo back to the trading dashboard to see the available stocks. Click on any stock to see its market details, including price movement and beta.
What Is Beta in Stocks? – Conclusion
Beta in stocks is essential to determining volatility. It compares the stock to a benchmark index, like the S&P 500. Stocks with a beta greater than one are more sensitive than the market, while those with less than one are less sensitive.
You can use the beta values to build and balance your portfolio between high- and low-risk stocks. However, that is best done by combining multiple risk measures. The popular ones include alpha, standard deviation, and r-squared.
Register with eToro to build your portfolio with beta. Trade stocks and ETFs directly from your mobile device.
Your capital is at risk
References
- https://edition.cnn.com/2022/12/08/investing/markets-stocks-higher/
- https://www.usbank.com/investing/financial-perspectives/investing-insights/diversification-important-in-investing-because.html
- https://economictimes.indiatimes.com/markets/stocks/news/impact-of-government-regulations-on-stock-market-volatility-a-study-of-selected-economies/articleshow/97796484.cms
- https://www.nber.org/papers/w25720
- https://money.usnews.com/investing/investing-101/articles/how-earnings-affect-stock-prices
FAQs
What is a good beta for a stock?
This depends on how much risk you are willing to take on. Less than one beta is ideal if you have a low-risk tolerance. A beta greater than one is good for high-risk investments.
What does a 1.5 beta mean?
This beta means the stock will gain or lose 1.5% for every 1% gain or loss in the benchmark index. It indicates a stock with high volatility.
What does a stock beta of 0.5 mean?
This beta means the stock will gain or lose 0.5% for every 1% gain or loss in the benchmark index. The stock is less volatile than the market.
Is it better to have a high or low beta in stocks?
Both depend on the season. A high beta is ideal in a bullish season, while a low beta is ideal in a bearish season. Your risk tolerance also decides which is better for you.

Jeremiah Awogboro

Jeremiah Awogboro
View all posts by Jeremiah AwogboroJeremiah Awogboro is an experienced content writer with over 8 years of experience. He has a qualified MBChB degree and a keen interest in the stock market and the finance industry. His background in the industry has provided him with valuable experience in this field. Awogboro is dedicated to assisting and reaching out to as many people as possible through his writing. In his spare time, he enjoys music, football, traveling, and reading.

eToro: Overall Best Stock App with 0% Commission
VISIT ETOROYour capital is at risk. Other fees apply. For more information, visit etoro.com/trading/fees.stockapps.com has no intention that any of the information it provides is used for illegal purposes. It is your own personal responsibility to make sure that all age and other relevant requirements are adhered to before registering with a trading, investing or betting operator. Contracts for Difference (“CFDs”) are leveraged products and carry a significant risk of loss to your capital. Please ensure you fully understand the risks and seek independent advice.By continuing to use this website you agree to our terms and conditions and privacy policy.
Trading is risky and you might lose part, or all your capital invested. Information provided is for informational and educational purposes only and does not represent any type of financial advice and/or investment recommendation.
Crypto promotions on this site do not comply with the UK Financial Promotions Regime and is not intended for UK consumers.
© stockapps.com All Rights Reserved 2026