Supertrend indicator explained – Trading Guide 2026

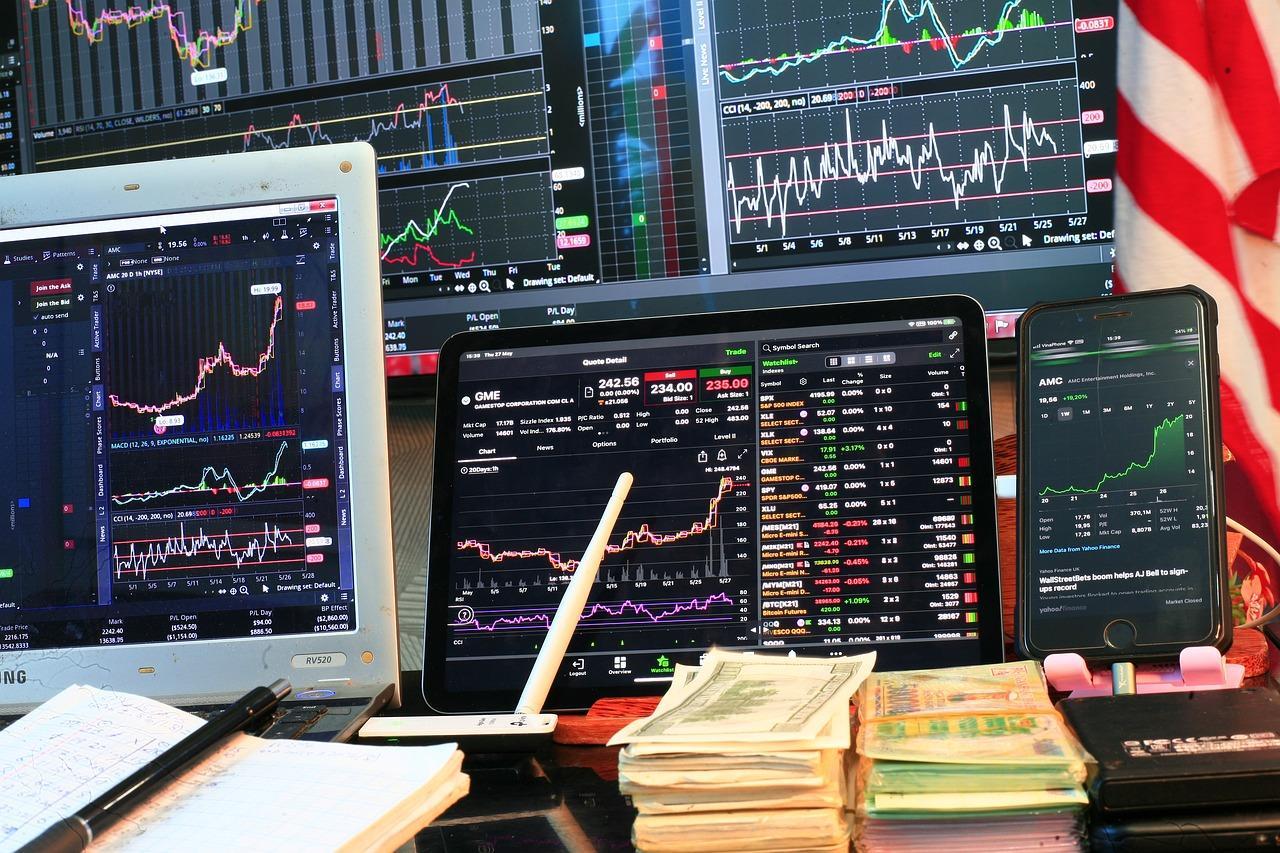
Technical indicators can help you grasp a market more than looking at charts with price movement alone. They are effective in making reasonable trading decisions.
The supertrend indicator is one of the simplest, quick to apply, and easy to interpret. It can be valuable when analyzing charts, candlesticks, baselines, bars, lines, etc. Most importantly, you’ll find it on most advanced trading platforms.
With the supertrend indicator explained, your trades will improve as you make more informed decisions. This article will answer the question “What is the supertrend indicator?” and explore its significance and how to calculate it. Then, you will understand when and where to apply it to your trading strategy.
-
-
Understanding Technical Indicators
Technical indicators are calculations based on the historical data of an asset. The data could be price movement, open interest, and trading volume. Hence, the security must have historical data before technical indicators work on it.

The other end of predicting the market is through fundamental data like a company’s earnings and profit margins. These are available at the best alternative data services, sometimes with AI predictions.
Role of Technical Indicators in Trading
Technical indicators do not guarantee 100% predictions. Today, we have AI stock-picking services that attempt to predict stocks with the best potential. While that is a welcome development, you are better off using more indicators to see things for yourself.
The role of technical indicators in trading includes the following:
- Identify a market’s direction and the trend’s strength (you can get this with the supertrend indicator settings)
- Understand the rate at which an asset’s price changes over time (the momentum)
- Understand an asset’s volatility (fluctuations and instability)
- Analyze trading activity on an asset (an example is measuring the cash flow for an asset)
Types of Technical Indicators
Tools used as technical indicators fall into two categories, as follows:
Overlays
These technical indicators use the same scale as the prices. Hence, they occur over the top of an asset’s price chart. Prominent examples are the moving averages and Bollinger bands.
Oscillators
These indicators move between the local maximum and minimum. Hence, you’ll find them above or below a price chart. Prominent examples include the MACD, the RSI, and the Stochastic oscillator.
Disclaimer: Don’t invest unless you’re prepared to lose all the money you invest. This is a high-risk investment and you should not expect to be protected if something goes wrong. Take 2 mins to learn more.
What is the Supertrend Indicator?
The supertrend indicator is a technical indicator that shows an upward or downward market trend. Oliver Seban developed this tool, which has become famous for evaluating stocks, forex, and commodities. The line plot occurs on the price chart, capturing the direction of an asset’s momentum.

Long-term investors have no issues with a sideways market, as they are often in it for months or years. A short-term investor who prefers day trading apps will struggle with them, as there is no clear opportunity for quick profits. However, when trends occur, the supertrend indicator becomes even more helpful.
Definition and Purpose
The most important question to address is, What is the supertrend indicator? This forms the foundational knowledge needed to use it effectively in trading. We’ll give you our thoughts on the supertrend indicator explained and its primary purpose in trading.
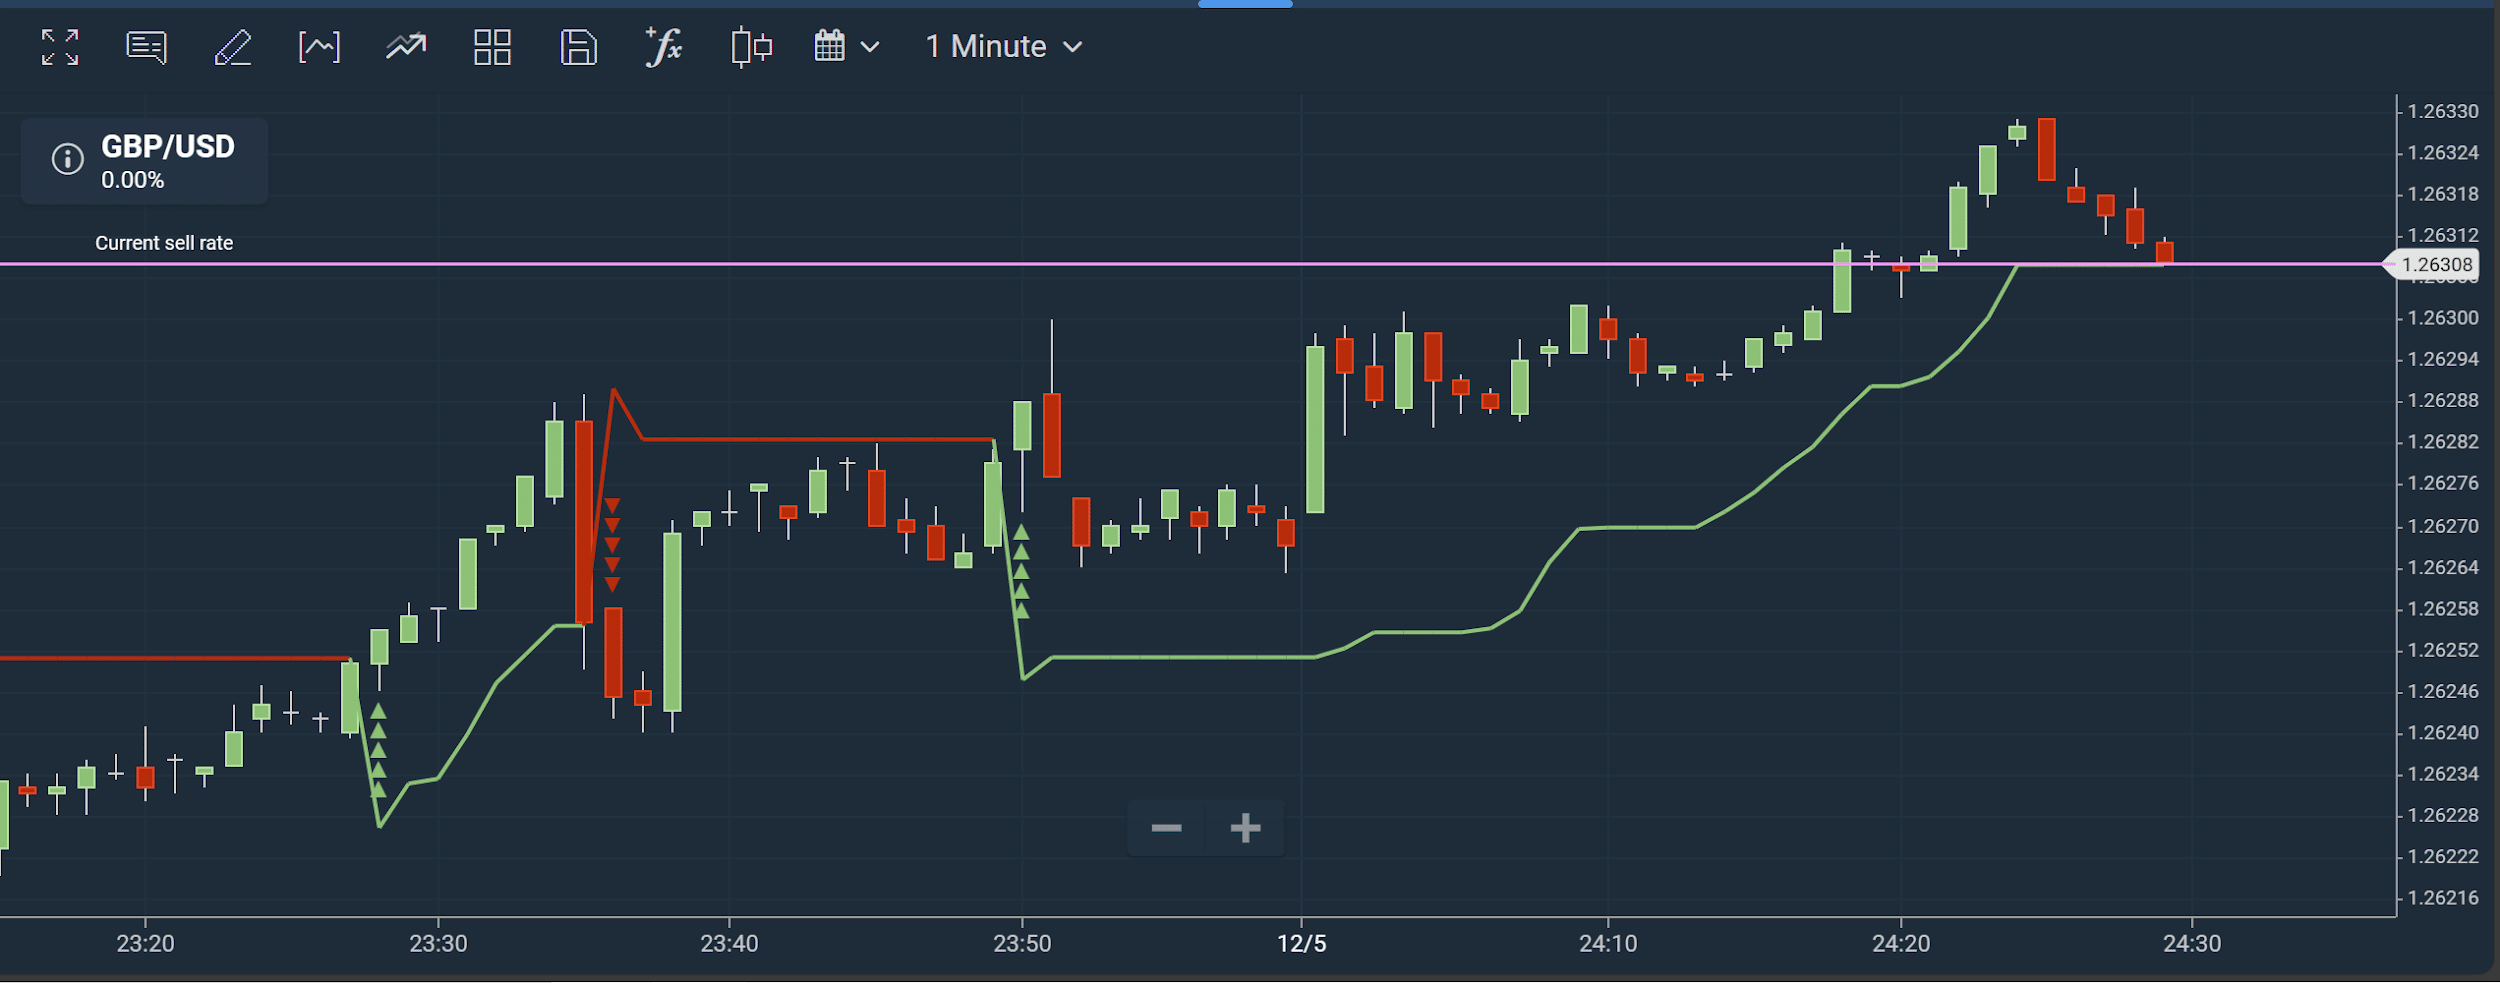
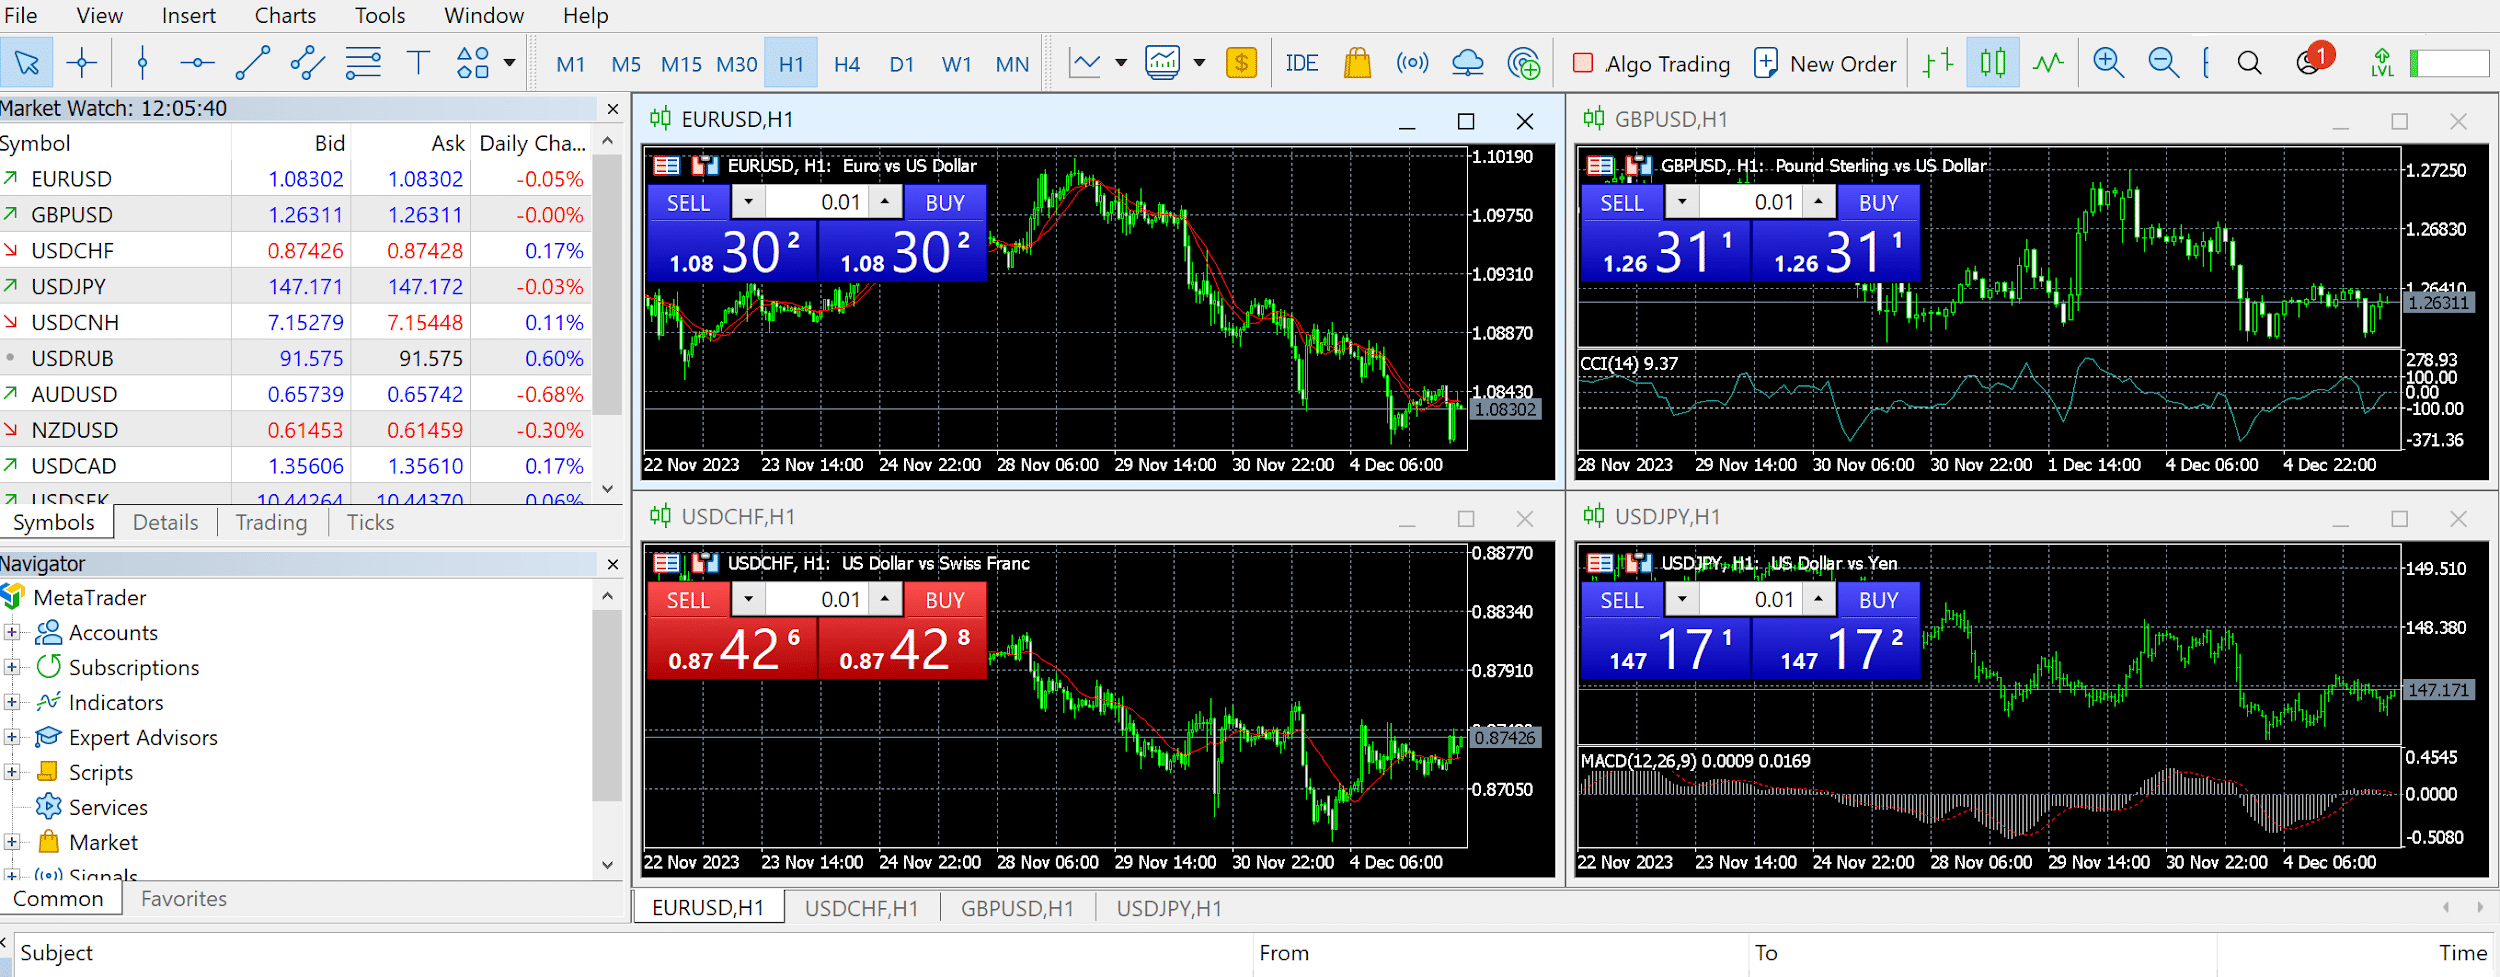
The supertrend indicator shows a market’s upward or downward trend. Once applied, the line plot will overlay the price movement. Like the chart above, the usual representation is with green and red lines.
Assets that close above the supertrend indicator are in an upward trend or bullish season. Conversely, assets that close below the supertrend indicator are in a downward trend or bearish season. This indicator thus helps identify an asset’s momentum within a particular period.
The primary purpose of the supertrend indicator explained is to identify entry and exit points in a market. Stay too long in a trade, and you might lose even the little profit accumulated.
Calculation Methodology
Unlike most technical indicators, the supertrend indicator is easy to calculate. Trading apps that have it will do the calculations behind the scenes. However, it is essential to know the methodology, as we cover everything in this supertrend indicator explained.
The essential terms used in the supertrend indicator formula include the following:
- The average true range (ATR): This measures an asset’s price variation within a given period. Its basic calculation is the difference between the current high and the current low. Also, it includes the absolute values of the differences between the current high and the previous close and the current low and the previous close.
- Period: This refers to the days covered in the average true range.
- Multiplier: This value multiplies the average true range in the supertrend indicator formula. It indicates how sensitive the supertrend indicator explained is. Higher numbers show less sensitivity, while lower numbers show high sensitivity.
You must first determine the period and multiplier to use. Then, you will calculate the average true range for the period. The final calculation is much easier, as seen in this supertrend indicator explained.
Significance of the Supertrend Indicator

Significance of the Supertrend Indicator
We’ve answered the basic question in this comprehensive supertrend indicator explained piece (What is the supertrend indicator?). The preliminary explanation shows the primary purpose of identifying trends. This is helpful when investing.
The supertrend indicator can be helpful when using stock market research and analysis software to plan your investments. Here is the top significance of the supertrend indicator explained:
Identifying Trends and Directions
A glance at the indicator reveals market trends. As mentioned in this supertrend indicator explained piece, you can have green and red lines. The green lines show when an asset’s price finishes above the indicator.
When in green, an asset is in an uptrend or bullish. To some, that can be the time to buy into the market. When in red, an asset is in a downtrend, often a time to sell.
Volatility Measurement
You’ll quickly identify fluctuations with this technical tool. Although you won’t have direct figures, the fluctuations can help gauge an asset’s volatility. Look for swings in the price movement.
An asset that swings too often in a short time is highly volatile. To some, it can be a high-risk opportunity to make a profit. Nevertheless, we recommend adding other indicators and looking for beta in stocks before jumping on the volatile trend.
Supertrend Indicator Formula Explained
What is the supertrend indicator based on? As mentioned earlier, this tool uses price data over a specific period. There are a few supertrend indicator settings you can adjust to identify buy-in or sell-off opportunities.
Let’s review the basic components of the supertrend indicator formula and how to calculate them.
Basic Components of the Formula
The basic components of the supertrend indicator formula include the following:
Average true range
- The ATR = [ATR for p – 1 period * (p – 1) + current TR] / p
- Where p = period (often the number of days)
True Range
- TR = the max value among [high – low, |close – high|, |close – low|]
- Where close = closing price of the previous day
The true range includes the closing price of the previous day. Hence, it is often above the normal range.
With these, you can calculate the supertrend upper and lower lines as follows
- Upper line = high + [multiplier * ATR]
- Lower line = low – [Multiplier*ATR]
A Step-by-Step Calculation Example
Here’s an example to put the above formulas into perspective. Let’s assume we want to calculate the supertrend for the shares of company XYZ for 20 days using a multiplier of 3.
Here are the steps we will use:
Step 1: calculate the average true range
Begin by collating the close, high, and low prices for the 20 days needed. Calculate the true range for each day. Use the formula in the previous section to calculate the true range.
Step 2: calculate the average true range
The first thing to do here is to find the average of the true range for the past 20 days. Then, use that in the ATR formula to find the average true range.
Step 3: Calculate the upper and lower bands for each day
The formulae for the basic bands are as follows:
- Basic upper band = [high + low] / [2 + (multiplier * ATR)]
- Basic lower band = [high + low] / [2 – (multiplier * ATR)]
Step 4: Calculate the final upper and lower bands
Use the formula below:
- Final upper band = current basic lower band (if current basic upper band < previous final upper band and previous close < previous lower band)
- Final upper band = previous final lower band if the above conditions are not true
- Final lower band = current basic lower band (if previous final lower band < current basic lower band and previous final lower band is lower than previous close)
- Final lower band = previous final lower band if the above conditions are not true
Step 5: calculate the supertrend
Use the approach below
- Supertrend = current final upper band if current final upper band >= current close
- Supertrend = final lower band if the above condition is not true
Parameters Affecting the Supertrend Calculation
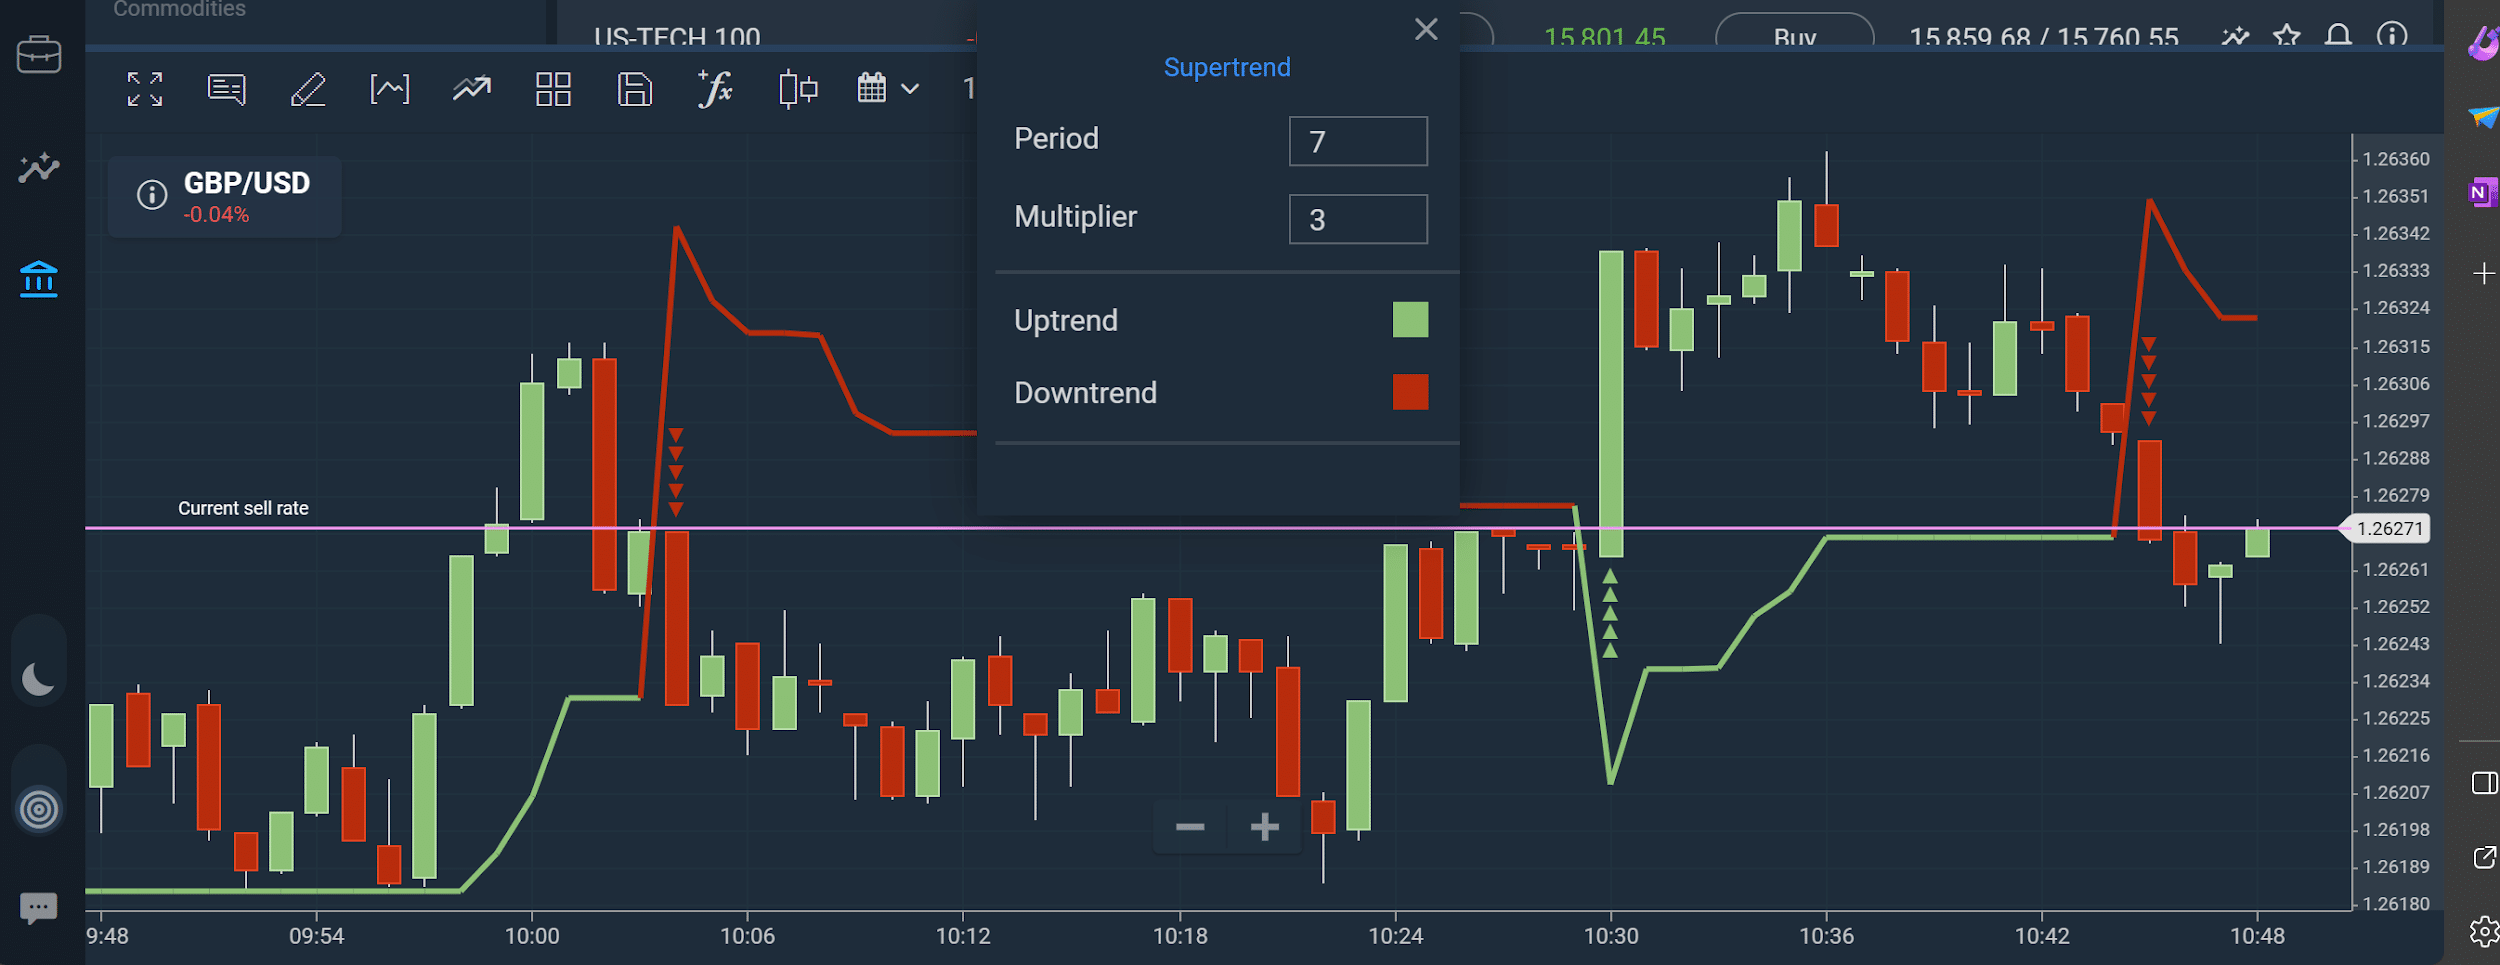
The supertrend indicator settings are unfixed. You can adjust a few parameters to finetune it according to your trading needs. These parameters are available on stock trading apps with the indicator on their technical charts.
You can use a demo trading app to learn how to work with and adjust the supertrend indicator settings. The adjustable parameters are the ATR period and the multiplier. Most trading platforms will default to 7 for the period and 3 for the multiplier.
ATR Period and Multiplier
The ATR period can either be short or long. These supertrend indicator settings give different results and interpretations. Shorter periods give quicker reactions on the supertrend.
Quicker reactions might be challenging to follow as a new trader. Hence, we recommend using extended periods if you are a new trader. Extended periods have smoother curves that are easier to follow.
For the multiplier, this parameter shows how sensitive you want the supertrend to be to the market. Using a higher multiplier makes the supertrend more tolerant of price changes. That could be good for long-term investors but not valuable for short-term traders.
Instead, you should use lower multipliers closer to zero. That makes the supertrend more sensitive to price changes. You can make quick decisions with the indicator.
Adjusting Parameters for Different Timeframes

Here are the steps to adjust the parameters for different timeframes:
- Open the trading platform and add the supertrend indicator to your charts for the given asset.
- Right-click anywhere on the supertrend line.
- Input your preferred number for the period.
- Input your preferred number for the multiplier
- Press enter to apply the adjustments
Adjusting your supertrend is easy. You can also change the colors to fit your preferences.
Interpretation of Supertrend Values
What is the supertrend indicator MT4 if it doesn’t aid our trading decisions? The key lies in its interpretation. Those up-and-down swings say a lot about the market, enough to keep you on track if you are careful.
Understanding Supertrend Signals
A supertrend occurs above or below an asset’s price movement on a technical chart. When it moves below the closing price, it signifies an ideal period to buy or hold. The color changes to green, indicating an upward trend for the asset.
On the other hand, the supertrend occurring above the closing price signifies an ideal period to sell. The color changes to red, indicating a downward trend for the asset.
Interpreting Crossovers and Trend Changes
There are moments on the graph where the supertrend and the closing price meet. These are called cross-over points and can be essential for determining entry and exit points in a trade.
Follow the previous trend to understand the shift in momentum. Then, buy the asset or sell it off.
Disclaimer: Don’t invest unless you’re prepared to lose all the money you invest. This is a high-risk investment and you should not expect to be protected if something goes wrong. Take 2 mins to learn more.
Incorporating the Supertrend Indicator in Your Strategy

The supertrend indicator MT4 signifies changes in trends. It can also show the continuation of a trend. Hence, it is essential to any short-term trading strategy, although we recommend adding other indicators.
Here are some prominent strategies you can incorporate the supertrend indicator MT4 into:
Trend-Following Strategies
You can use the supertrend to confirm trends and determine whether to hold your asset or increase your investment. The process begins by setting up the indicator on the technical chart. If it shows green up to the present, the asset is on an upward trend.
With the upward trend, you can buy or hold assets in your current portfolio. If the indicator shows red up to the present, the asset is in a downward trend. The prudent thing will be to sell it if you are a short-term trader.
Swing Trading Strategies
You must know the best time to purchase or sell an asset. These are called entry and exit points in trading. Fortunately, the supertrend indicator MT4 can show entry and exit signals through crossovers.
If the crossover happens from a downward trend, that could mean a swing to a bullish run. Buying an asset at this time to maximize your profits will be ideal. If the crossover happens from an upward trend, that could mean a swing to a bearish market—sell to avoid losses.
Supertrend as a Stop-Loss Tool
You can use the supertrend indicator MT4 to minimize loss through stop loss. You can do that by placing stop loss levels or using the trail stop strategy.
Placing Stop Loss Levels with Supertrend
Here’s how to place stop loss levels with the supertrend indicator MT4
For long positions (during purchasing),
- Place your stop loss a little below the supertrend upper line. That will protect your investment against potential sharp trend reversals.
For short positions (during sales)
- Place your stop-loss a little above the supertrend lower line.
- Use your risk tolerance to adjust your position.
- Consider the distance between the stop-loss level and your entry point when adjusting your position.
Trail Stop Strategy with Supertrend
Sometimes, you must adjust the stop loss instead of setting it once and for all. For long positions, trail the stop loss below the supertrend upper line and adjust it to stay below the line. On the other hand, for short positions, trail the stop loss above the supertrend lower line and ensure it stays above the line.
Supertrend in Combination with Other Indicators
This tool is best used with other indicators as it can produce false readings, a limitation we’ll see subsequently. The most prominent indicators you can use with the supertrend include the following:
Moving Averages and Supertrends
Here’s how you can combine moving averages (the exponential moving average) with the supertrend:
For long trades For short trades Enter a long position if the supertrend is bullish and the EMA confirms the uptrend. Your stop loss should be below the least indicator, either the supertrend or the EMA. Enter a short position if the supertrend is bearish and the EMA confirms the downtrend. Your stop loss should be above the highest indicator, either the supertrend or the EMA. RSI and Supertrend
Combining the supertrend with the RSI can help determine entry and exit points for long and short trades. The table below shows how you can do that:
For long trades For short trades Enter a long trade when the supertrend is less than 0 and the RSI buy signal is about 7. Exit a short trade when the RSI becomes oversold (28) and the supertrend becomes less than 0. Exit a long trade if the RSI becomes overbought (72) and the supertrend changes direction. Disclaimer: Don’t invest unless you’re prepared to lose all the money you invest. This is a high-risk investment and you should not expect to be protected if something goes wrong. Take 2 mins to learn more.
Choosing the Right Timeframes and Markets
The timeframe depends primarily on your trading style. However, you should also consider the asset’s liquidity. You shouldn’t stay too long when the liquidity does not favor long-term trading. Let’s see how you can adapt the supertrend to short- and long-term trading.
Adapting Supertrend to Short-Term and Long-Term Trading
If you are a short-term trader, use a shorter timeframe for the supertrend. This setting will catch rapid price movements and help you make quick decisions. Conversely, use a longer timeframe for long-term trading, as you will have a smoother and less sensitive curve.
Applying Supertrends in Different Financial Markets
You can apply the supertrend to different financial markets. Metatrader4 is better suited for forex, but you can use the indicator for commodities and stocks. While applying, you can backtest your strategy with historical data to see its efficiency.
Disclaimer: Don’t invest unless you’re prepared to lose all the money you invest. This is a high-risk investment and you should not expect to be protected if something goes wrong. Take 2 mins to learn more.
Managing False Signals and Whipsaws
The supertrend captures trends. However, it can be misleading in specific conditions. Identify these false signals and back up your trading decisions with other indicators.

Here are ways you can manage false signals:
Identifying and Minimizing False Signals
During sideways markets, minor price fluctuations may generate frequent signals. The supertrend can also produce false signals in ranging markets. Also, the indicator may lag in volatile markets.
While remembering these scenarios, proceed to the next step to make better decisions.
Confirming with Additional Analysis
Earlier, we showed how to combine other indicators with the supertrend. The best investment tools and analysis software can help you make a more rounded decision. Confirm the supertrend signals with other indicators.
Backtesting and Optimization
Backtesting involves evaluating a trading strategy with previous price data. Apps that support this, like eToro, can run simulations with your strategy. Then, you can identify areas for improvement and optimize them before applying them to upcoming trades.
Importance of Backtesting with Supertrend
Backtesting allows you to identify the strengths and weaknesses of your strategy before applying it to the real market. With the supertrend, you can identify if your strategy maximized an uptrend or minimized losses during a downtrend.
You can also use backtesting to adjust the supertrend parameters. For example, you can adjust the timeframe and multiplier to fit the market better.
Optimizing Parameters for Maximum Effectiveness
For new traders, this process will likely be trial and error. Start with the default values on the trading platform and backtest with these values. Then, adjust and continue testing until you have the best market fit.
Disclaimer: Don’t invest unless you’re prepared to lose all the money you invest. This is a high-risk investment and you should not expect to be protected if something goes wrong. Take 2 mins to learn more.
Risk Management and Position Sizing
Trading comes with risk, especially in a highly volatile market. Hence, risk management is essential for any trader hoping to make a profit. With risk management comes position sizing.
You can boost your risk management strategy with the supertrend. Moreover, what is the supertrend if it doesn’t aid in your trading decisions?
Incorporating Supertrends into Risk Management Strategies
Using supertrends in risk management is easy. Add the indicator when analyzing the market. Note the prevailing trend before entering a new trade, as that will show investment opportunities.
Use the supertrend to identify highly volatile markets. You might be better off avoiding such markets, depending on your risk tolerance.
Determining Position Sizes Based on Supertrend Signals
Assets with a significant uptrend might be worth investing more in than assets with less. Use the supertrend to identify assets that have significant uptrends. Also, consider when a market is overbought before buying.
Disclaimer: Don’t invest unless you’re prepared to lose all the money you invest. This is a high-risk investment and you should not expect to be protected if something goes wrong. Take 2 mins to learn more.
Supertrend indicator explained – eToro Complete Guide
The supertrend indicator is easy to use. However, we recommend backtesting and optimizing it before applying it to your trades. For this purpose, eToro tops our recommended platforms for trading with the supertrend indicator.
This platform offers a demo account with $100,000 to get you started. The trading dashboard is user-friendly for beginners and experts. Follow the steps below to register and start trading with eToro:
Note: Only cryptocurrencies eToro customers in the United States will be able to trade on the platform will be Bitcoin, Bitcoin Cash, and Ethereum.
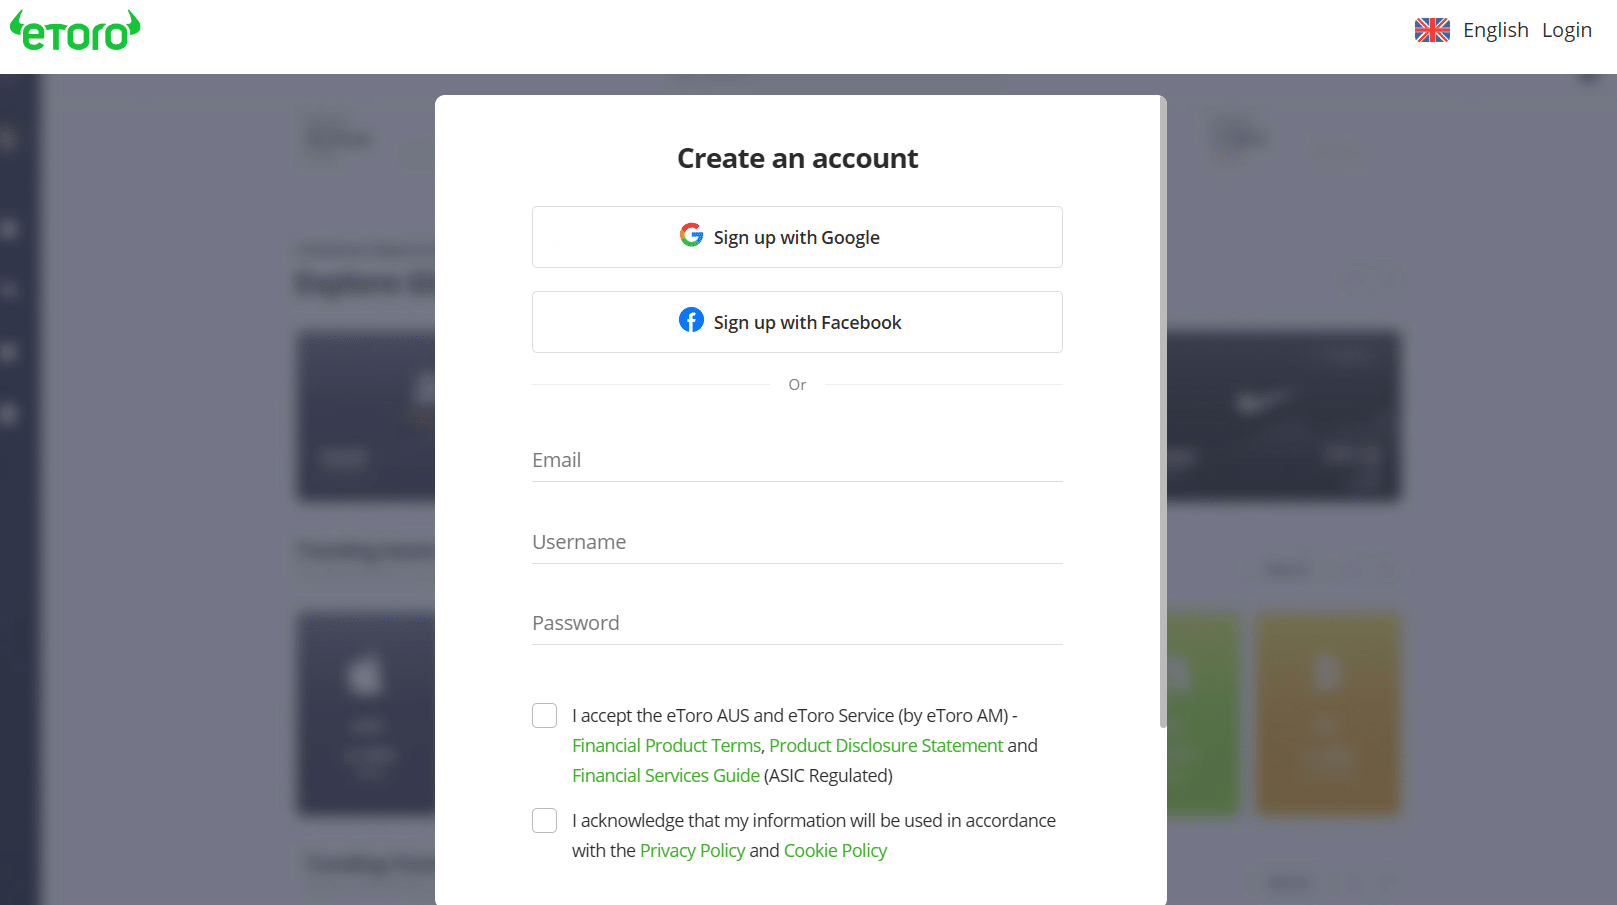
 Step 1: Register for a new eToro account
Beginners can start with the demo account. If you are already versed in trading, opt for the real account. Both share the same registration process.
Open the eToro website using our link. Click “Join eToro” to open the registration page.
Step 2: Provide your login detailsYour email and password are the primary login details. Ensure you use your active email and create an easy-to-remember but strong password. Create a username and check the boxes for the privacy policy and the terms and conditions.
Step 3: Verify your emailOpen your email inbox and copy the verification code. Input the code on the eToro registration page. Your registration should be successful after you enter the code.
Log into your eToro account to continue.
Step 4: Deposit or use the virtual accountGo to the deposit page and enter the amount you want to deposit. Input your card details, including your name, and proceed with the payment. Alternatively, you can switch to a virtual account.
Step 5: Start tradingGo to the trading dashboard and search for the asset. Click on it to open the technical charts. Add the supertrend indicator and start trading.
Supertrend indicator explained – Conclusion
We’ve answered the question (what is the supertrend indicator?) extensively. Its primary purpose is to identify uptrends and downtrends. It is a simple tool but is best used with other indicators like moving averages and the RSI.
Use a reputable trading tool when working with the supertrend. eToro is our top recommendation.
Disclaimer: Don’t invest unless you’re prepared to lose all the money you invest. This is a high-risk investment and you should not expect to be protected if something goes wrong. Take 2 mins to learn more.
References
https://edition.cnn.com/2023/11/28/investing/premarket-stocks-markets-2024/index.html
https://www.forbes.com/advisor/investing/what-is-asset-allocation/
https://www.nytimes.com/2023/11/24/business/stock-market-hold-sell-timing.html
FAQs
How does the Supertrend indicator work?
This indicator uses the average true range and a multiplier to show an asset’s uptrend or downtrend. An uptrend occurs when the asset’s closing price is above the indicator. Conversely, a downtrend occurs when the asset’s closing price is below the indicator.
Is Supertrend a reliable indicator?
The indicator can produce reliable results in robust markets. However, it might be misleading in sideways markets. We recommend combining it with other indicators.
What is the best setting for Supertrend indicator?
The best setting is to use a period of 10 and a multiplier of 3. This setting is often the default on most trading platforms.
What is the best period for Supertrend?
Backtest and adjust the period to get the best for your trading strategy.

Jeremiah Awogboro

Jeremiah Awogboro
View all posts by Jeremiah AwogboroJeremiah Awogboro is an experienced content writer with over 8 years of experience. He has a qualified MBChB degree and a keen interest in the stock market and the finance industry. His background in the industry has provided him with valuable experience in this field. Awogboro is dedicated to assisting and reaching out to as many people as possible through his writing. In his spare time, he enjoys music, football, traveling, and reading.

eToro: Overall Best Stock App with 0% Commission
VISIT ETOROYour capital is at risk. Other fees apply. For more information, visit etoro.com/trading/fees.stockapps.com has no intention that any of the information it provides is used for illegal purposes. It is your own personal responsibility to make sure that all age and other relevant requirements are adhered to before registering with a trading, investing or betting operator. Contracts for Difference (“CFDs”) are leveraged products and carry a significant risk of loss to your capital. Please ensure you fully understand the risks and seek independent advice.By continuing to use this website you agree to our terms and conditions and privacy policy.
Trading is risky and you might lose part, or all your capital invested. Information provided is for informational and educational purposes only and does not represent any type of financial advice and/or investment recommendation.
Crypto promotions on this site do not comply with the UK Financial Promotions Regime and is not intended for UK consumers.
© stockapps.com All Rights Reserved 2026
We use cookies to ensure that we give you the best experience on our website. If you continue to use this site we will assume that you are happy with it.Scroll Up