What is the MACD Indicator? – Trading Guide 2026

Day, swing, and position traders will, at some point, wonder what the MACD indicator is. It is a valuable oscillator that can provide buy and sell signals, albeit subjective. Hence, you must interpret it skillfully, especially during trending market conditions.
You don’t need to look beyond moving averages when answering this question. This oscillator derives its reading from the simple and exponential moving averages. It can appear as a line chart or histogram, giving you an in-depth view of price movements.
The best approach is to use it to identify trends, including overbought and oversold conditions. With that in mind, let’s see how we can make the most of this lagging oscillator.
-
-
What is the MACD Indicator? – Introduction
Stocks and other assets gain and lose momentum as they trade over a period. Gaining momentum results in uptrends, while losing momentum results in downtrends.
The MACD is one way to gauge an asset’s momentum. You’ll find this indicator on the best day trading apps if you are a day trader. Swing and position traders can also use them on their preferred platforms.
Definition and explanation of the MACD (Moving Average Convergence Divergence) indicator
Our first step is exploring the basics of what the MACD indicator holds. The primary definition of the MACD indicator is that it is a momentum tool that reveals the relationship between two exponential moving averages. Often, the moving averages are short- and long-period.
Plotting the difference alone does not give the convergence and divergence in the price movement. Hence, the moving average convergence divergence indicator adds a signal line. You’ll have the MACD line and the signal line, converging and diverging at different points.
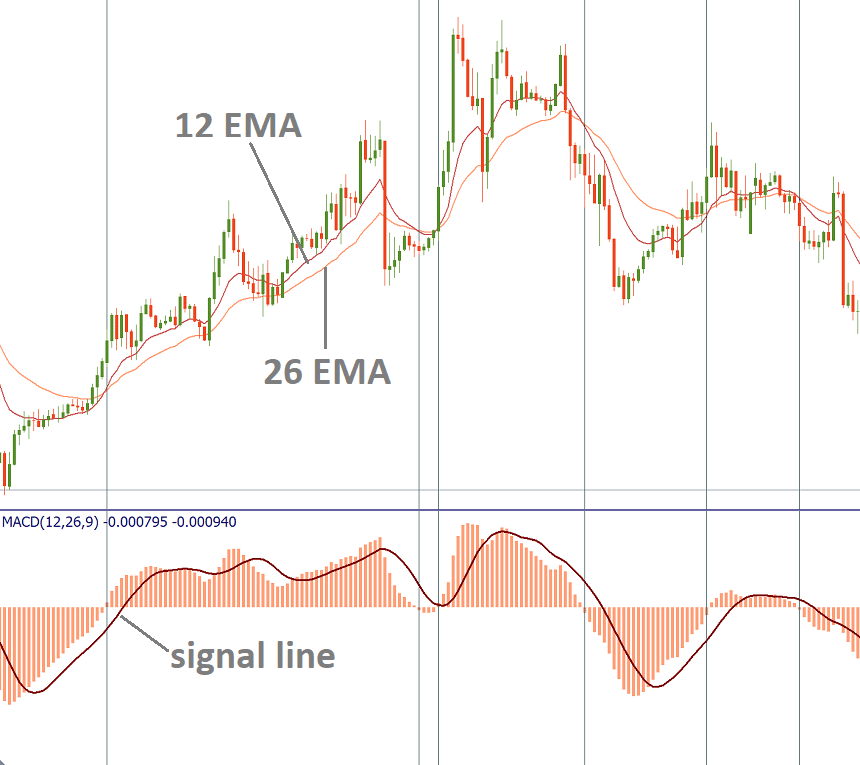
Most technical analyses use a 12-day exponential average and a 26-day exponential average for the calculation. Some trading platforms use 12-period and 26-period, which mean the same thing. We will see more during its calculations, including an answer to the question “What is the zero line in MACD indicator?”

The signal line is often a 9-day exponential average. It differs from the two periods picked for the MACD calculation. Hence, there will be moments when the MACD line crosses from below the signal line and vice versa.
Expect upward momentum when the MACD line crosses from above the signal line. A downtrend occurs if the reverse is the case. Nevertheless, these derivatives are not 100% guarantees or predictions of market movement.
We say that because they are the most basic derivations from the MACD. The question reveals that primary detail. You can use an AI stock trading app for quick insights and backup information.
Understanding the Purpose and Significance of the MACD in Technical Analysis
The MACD takes the moving average indicator to a higher and more usable level. It is more expository and insightful because of the added parameters. You can gauge the MACD and signal lines relationship to identify trends and momentums.
If you haven’t already, background knowledge of moving averages is essential. While we focus on what the MACD entails, you can read up on moving averages to get up to speed.
That said, here is the purpose and significance of the MACD in technical analysis:
- Trend identification: The MACD line can indicate a bullish or bearish trend, depending on where it crosses the signal line. That is something you can pick out at a glance.
- Momentum identification: A rising MACD line can mean bullish momentum and vice versa. Again, that is something you can tell by looking at the curve.
- Trading signals: The MACD line and the signal line will cross at different intervals. These crossovers can serve as buy or sell signals. Furthermore, the histogram provides additional information on the momentum to help you verify the buy and sell signals.
- Trend reversals: The MACD and the price movement will converge and diverge at specific periods. Higher lows in price and lower lows in the MACD can suggest a potential trend reversal to the upside. The opposite scenario would suggest a potential trend reversal to the downside.
- Forex and cryptocurrency analysis: Once understood, the MACD indicator and how to use it with cryptocurrency will not sound complicated. You can use it to analyze the crypto price trend before investing.
- Backup to other indicators: You can combine the MACD with other indicators, including the Fibonacci retracement, the RSI, the Bollinger Bands, etc.
The MACD can be applied to multiple timeframes for better insights.
History and Development of the MACD
Origins of the MACD and its Creator

The creation of the MACD is credited to Gerald Appel. This distinguished technical analyst and author created the indicator in 1970. His goal was to have a tool that gave a comprehensive look at market trends, hence revealing trading opportunities.
Gerald Appel created the MACD as a combination of momentum indicators and trend-following elements. Today, the tool is widely used in the technical analysis of other assets, including commodities, indexes, metals, forex, etc.
Evolution and modifications of the MACD over time
Our exploration on what the MACD adds to trading looks robust today, but the indicator wasn’t always so. These are the modifications that have occurred over time:
- We moved from using a simple moving average for the signal line to an exponential moving average. This improvement gives a smoother line.
- The MACD histogram came on board to improve the visualization between the MACD and the signal line.
- Other variations, like the MACD divergence analysis, debuted
- Signal smoothing, parameter customizations, and digital integration into trading apps are now available
Disclaimer: Don’t invest unless you’re prepared to lose all the money you invest. This is a high-risk investment and you should not expect to be protected if something goes wrong. Take 2 mins to learn more.
MACD Calculation
While we don’t expect you to calculate and plot the line, the formula is worth knowing. Fortunately, it is simple enough to grasp.
Detailed formula and steps for calculating the MACD
Most stock market research and analysis software generates the figures from the formula instantly. A click of a button draws the line on the primary chart.
Let’s take the formula step by step to understand it better.
Step 1: Calculate the smoothing factor
This step is crucial, as the smoothing factor is part of the MACD formula. Hence, we must calculate it first.
The smoothing factor (K) = 2 / (n + 1), where n = period
Step 2: Calculate the 12-day EMA (EMA12)
EMA12 = Closing price * smoothing factor + [previous EMA12 * (1 – K)]
Step 3: Calculate the 26-day EMA (EMA26)
EMA26 = Closing price * smoothing factor + [previous EMA26 * (1 – K)]
Step 4: Calculate the MACD
MACD = EMA12 – EMA26
Step 5: Calculate the 9-period EMA (EMA9)
Step 6: Plot the histogram
The histogram is the difference between the MACD line and the signal line (EMA9).
Histogram points = MACD line – signal line

Interpretation of the MACD line
You’ll find crossovers between the MACD and the signal lines. These can signify bullish or bearish trends, depending on the crossover’s nature.
The MACD line moves up and down with the price movement. It can also indicate uptrends and downtrends in the price movement.
Disclaimer: Don’t invest unless you’re prepared to lose all the money you invest. This is a high-risk investment and you should not expect to be protected if something goes wrong. Take 2 mins to learn more.
Signal Line and Histogram
The signal line and histogram are integral to the MACD indicator. You need the signal line to get the histogram, which shows strength and momentum. This derivation can help determine trend reversals for trading.
Definition and calculation of the signal line
The signal line is the 9-period EMA of the MACD line. It is a smoother line, drowning out the MACD fluctuations.
One can’t fully understand what the MACD indicator is without mentioning the signal line. Here’s how it is calculated:
EMA9 = Closing price * smoothing factor + [previous EMA9* (1-K)]
However, you will use the MACD instead of the original asset price. In a way, the signal line is the moving average for the MACD.
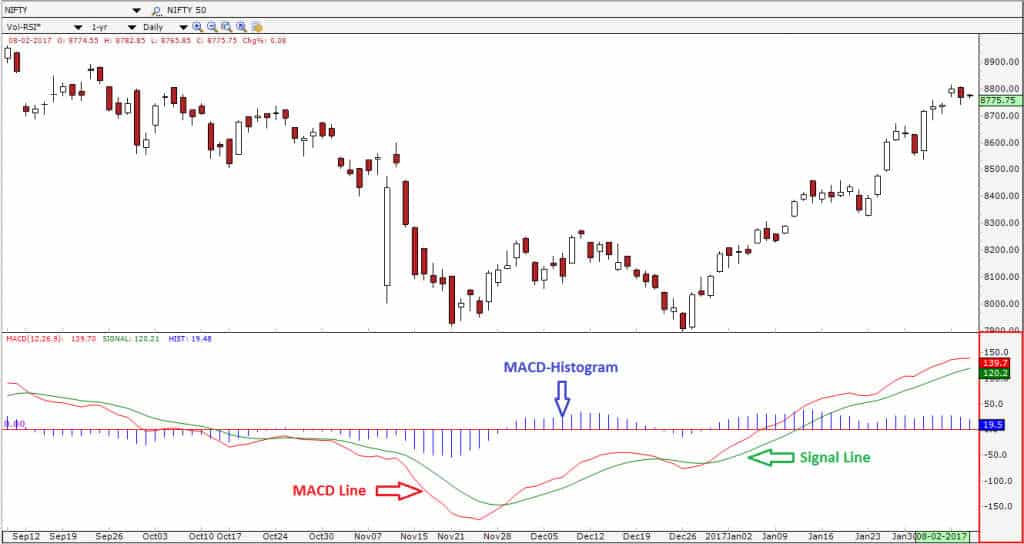
Understanding the histogram and its role in MACD analysis
The histogram is the difference between the MACD line and the signal line. These appear as bars above and below the zero line. The histogram performs the following functions:
- It visualizes momentum: A bullish momentum occurs when the histogram is above zero. Conversely, bearish momentum occurs when the histogram is below zero.
- It can help confirm trend reversals through positive and negative crossovers.
- The bar height can reflect trend strength. For example, taller bars indicate stronger momentum.
- The points of zero crossings can indicate bullish and bearish trends

Traders pay attention to bar crosses above and below zero as indicators of potential trend shifts. Using the histogram and MACD analysis, traders can better understand market momentum and possible trading opportunities.
MACD Crossovers
You can learn about the MACD indicator and how to use it with cryptocurrency. However, the approach is to look at the crossovers between the MACD line and signal lines. We captured these crossovers previously, but let’s get into more details.
Explaining bullish and bearish MACD crossovers
Bullish crossovers occur when the MACD line crosses the signal line from below. It ends up above the signal line in the direction of the trend. In other words, it means the 12-day EMA is increasing higher than the 26-day EMA.
Bearish crossovers occur when the MACD line crosses the signal line from above. It ends up below the signal line in the direction of the trend. In other words, it means the 26-day EMA gets closer to the 12-day EMA and might overtake it.
Using crossovers to identify potential trend reversals and trading opportunities
Bullish crossovers can indicate buy signals. However, you must compare it with the histogram to see if there is a trend reversal. If that happens, it might be a good time to buy.
The converse occurs during bearish crossovers. Observe the histogram to see if the uptrend is weakening. Notwithstanding, consider the overall trend and other indicators before taking a short position.
Disclaimer: Don’t invest unless you’re prepared to lose all the money you invest. This is a high-risk investment and you should not expect to be protected if something goes wrong. Take 2 mins to learn more.
Divergence and Convergence
One thing stands out on what the MACD indicator offers. You can expect the MACD line to converge and diverge with the price movement as trading continues. These peculiarities can help in trading decisions.
Understanding bullish and bearish divergence with the price chart
The asset price can create lower lows, while the MACD line creates higher lows. This divergence indicates a bullish trend, with expected increasing momentum. Close inspection might reveal a weakening downtrend.
Other times, the asset price can create higher highs while the MACD creates lower highs. This peculiarity indicates a bearish divergence that can reveal a weakening uptrend. The price might strengthen, but the momentum is waning.
Analyzing MACD convergence for trend confirmation
You can confirm a trend’s strength, direction, and momentum if the MACD converges with the price action. In this case, the price action might make higher highs while the MACD makes higher highs. The reverse can also be true of lower lows.
Convergence is rarely a buy-in opportunity. Instead, you can strengthen your position or wait out the trend.
Trend Identification with the MACD
The primary part of the MACD indicator lies in identifying trends with the MACD. New traders might find it challenging to use this indicator. We recommend practicing with a virtual account before using real money.
As mentioned at the beginning of this guide, this indicator is valuable to short-term, swing, and position traders. Let’s see how to use the MACD to identify a trend’s strength and direction.
Using the MACD to identify the strength and direction of the trend
You must pay attention to two things: the zero line and crossovers. A MACD line that stays above the zero line might indicate a strengthening bullish trend. That means the 12-day EMA is increasingly higher than the 26-day EMA.
Conversely, a MACD line below zero might suggest a bearish trend. The gap between the MACD and its baseline shows how strong the trend is. A wider gap means strong momentum, whether bullish or bearish.
Different timeframes for trend analysis using the MACD
how does the MACD indicator relate to timeframes? We mentioned customizations earlier. One of them is the ability to adjust the timeframes for trend analysis.
The 12-day and 26-day EMAs are standard. However, you can shorten them to make the MACD line more sensitive. That can help you identify trends quickly and make quick trades.
You can shorten the MACD to a 9-day EMA instead of 12. This approach is ideal for intra-day trades.
Overbought and Oversold Conditions
How the MACD can signal overbought and oversold market conditions
The zero line is crucial to identifying overbought and oversold market conditions. Also, you must fall back on the histogram and signal line crossovers to see market sentiment.
Strong positive bars can move from a bullish trend to overbought conditions. The opposite applies when large negative bars indicate oversold conditions.
Another way is through bullish and bearish divergences. Price action hitting higher highs with the MACD hitting lower highs can indicate overbought conditions. Conversely, lower lows for the price action and higher lows for the histogram can indicate an oversold condition.
Strategies for trading overbought and oversold signals
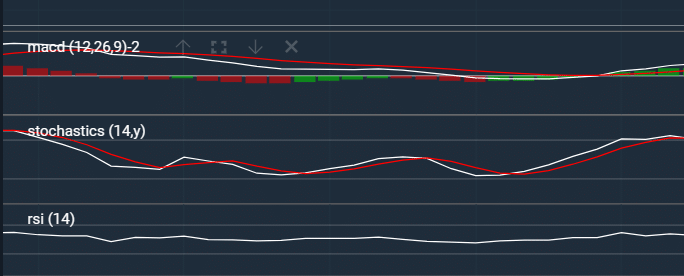
The best strategy is to use several indicators and wait for a signal before entering a trade position. The RSI and stochastic oscillator are indicators you can add to get improved and more direct signals.
Other strategies include the following:
- Compare the price chart trendlines with the histogram. Reversals may occur when prices touch a trendline.
- Use different timeframes to check the strength and momentum.
Disclaimer: Don’t invest unless you’re prepared to lose all the money you invest. This is a high-risk investment and you should not expect to be protected if something goes wrong. Take 2 mins to learn more.
MACD and Moving Averages
Combining the MACD with different types of moving averages
The table below shows the benefits of combining the MACD with other moving averages:
Moving average Benefit The MACD combo It involves using two moving averages (50 and 100 SMA). It is helpful for long trades when the price trades above the 50 and 100 SMAs and short trades when the price trades below the 50 and 100 SMAs Hull-moving averages This approach reduces lag and enhances responsiveness Using moving average crossovers with the MACD for stronger signals
Crossovers can be essential for reversals. You can use them to confirm trends and trade when they occur. Refer to our section on crossovers to know when the market is bullish or bearish.
MACD with RSI and Stochastic
The RSI indicator can quickly show an overbought or oversold asset. Combining that with the MACD can confirm your initial findings. Of course, you are better informed when trading.
This part wraps up our guide to what the MACD indicator is. Here’s how to integrate these indicators with the MACD:
Integrating the MACD with other oscillators like RSI and Stochastic
Go to the chart and add the RSI, or stochastic oscillator, to the price movement. The primary benefit is confirming oversold or overbought conditions from your MACD histogram. You’ll know when to buy, sell, or wait.
The stochastic oscillator can identify potential reversals. Hence, you can time your trades better.

Identifying confirmation signals using multiple indicators
Sometimes, multiple indicators validate themselves, giving the same outcomes. Other times, they may produce different results. For example, the MACD histogram might show overbought conditions when the RSI doesn’t.
Using multiple indicators is the best approach.
Trading with the MACD Indicator: The eToro Complete Guide
Do you think we’ve given a satisfactory answer to what the MACD indicator entails? You can practice what you’ve learned with the eToro virtual portfolio. Professional traders can deposit and use the advanced tools and indicators on the platform.
Here’s our complete eToro guide to opening a trading account:
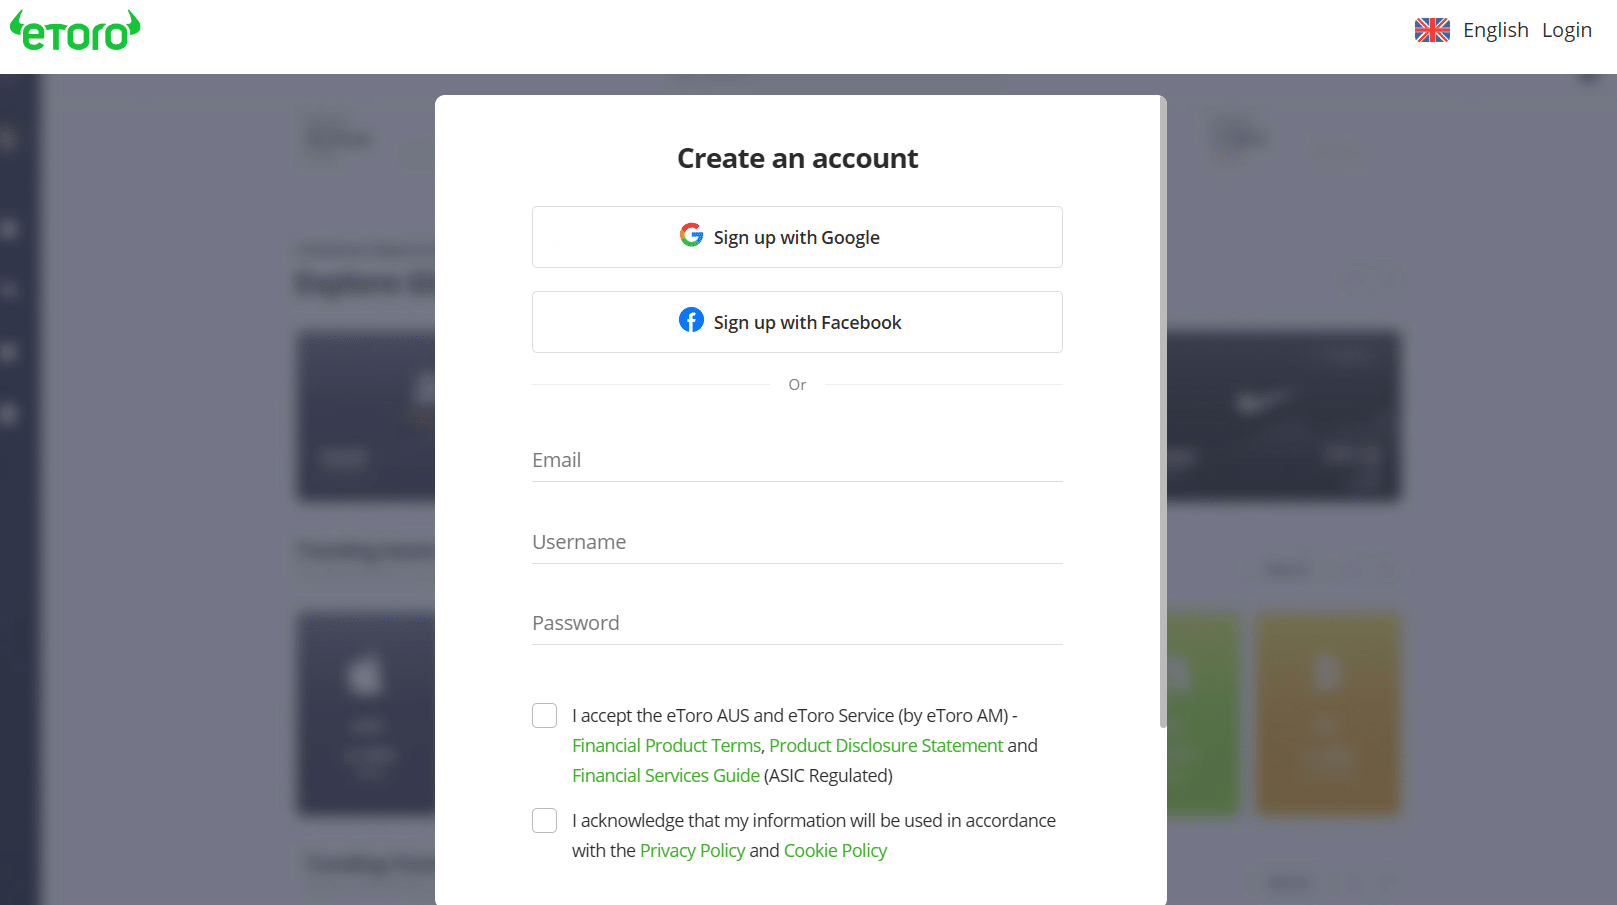
 Step 1: Register on the website
Open the homepage and click “eToro.” The registration page will open, allowing you to add your email, username, and password. You can also register with your Gmail or Facebook accounts.
Step 2: Download the appGo to the footer on the homepage to find the download links. eToro has links for Android and iOS devices. Click the appropriate one to download the app.
Step 3: Verify your identity and depositYour email is the first verification. Once complete, log in and upload relevant documents for your identity. Fund your account via credit card to access the real-money dashboard.
Step 4: Start tradingBrowse assets you like and view their charts. Go to the indicators tab and add the MACD, the RSI, and the stochastic oscillator.
What is the MACD indicator? – Conclusion
The MACD is an easy-to-use tool to identify trends and reversals. Its crossovers and histogram can help you pinpoint buy and exit points. However, ensure you use this indicator with others, like the RSI and the stochastic oscillator, for trend and position confirmation.
Explore our guide on crypto trading tools to understand the MACD indicator and how to use it with cryptocurrency.
Register and start trading with eToro.

Disclaimer: Don’t invest unless you’re prepared to lose all the money you invest. This is a high-risk investment and you should not expect to be protected if something goes wrong. Take 2 mins to learn more.
References
- https://fortunly.com/articles/risk-management-in-trading/
- https://www.thebalancemoney.com/trading-sideways-definition-examples-making-money-3305900
- https://bottomstreet.com/news-impact-stock-market/#
- https://www.fortunebusinessinsights.com/online-trading-platform-market-104934
- https://www.forbes.com/sites/brettsteenbarger/2021/01/08/mastering-your-trading-psychology/
FAQs
What does the MACD tell us?
This indicator helps identify trends and reversals through divergence patterns and crossovers.
What are the 3 numbers in MACD?
The three primary numbers include the smoothness factor, the short-term EMA, and the long-term EMA.
Which indicator is better, MACD or RSI?
The RSI is more reliable for markets that are not trending. It is easier to identify overbought and oversold conditions.
What is the best setting for the MACD indicator?
The best setting is using the 12-day and 26-day EMAs for the MACD line and the 9-day EMA for the signal line.

Jeremiah Awogboro

Jeremiah Awogboro
View all posts by Jeremiah AwogboroJeremiah Awogboro is an experienced content writer with over 8 years of experience. He has a qualified MBChB degree and a keen interest in the stock market and the finance industry. His background in the industry has provided him with valuable experience in this field. Awogboro is dedicated to assisting and reaching out to as many people as possible through his writing. In his spare time, he enjoys music, football, traveling, and reading.

eToro: Overall Best Stock App with 0% Commission
VISIT ETOROYour capital is at risk. Other fees apply. For more information, visit etoro.com/trading/fees.stockapps.com has no intention that any of the information it provides is used for illegal purposes. It is your own personal responsibility to make sure that all age and other relevant requirements are adhered to before registering with a trading, investing or betting operator. Contracts for Difference (“CFDs”) are leveraged products and carry a significant risk of loss to your capital. Please ensure you fully understand the risks and seek independent advice.By continuing to use this website you agree to our terms and conditions and privacy policy.
Trading is risky and you might lose part, or all your capital invested. Information provided is for informational and educational purposes only and does not represent any type of financial advice and/or investment recommendation.
Crypto promotions on this site do not comply with the UK Financial Promotions Regime and is not intended for UK consumers.
© stockapps.com All Rights Reserved 2026