What is Fibonacci retracement? – Trading Guide 2026

The Fibonacci numbers and the golden ratio occur in nature, from the pines of a pineapple to the leaves on a stem. Hence, some traders believe stock and asset prices follow this pattern. That causes new traders to ask, What is Fibonacci retracement in trading?
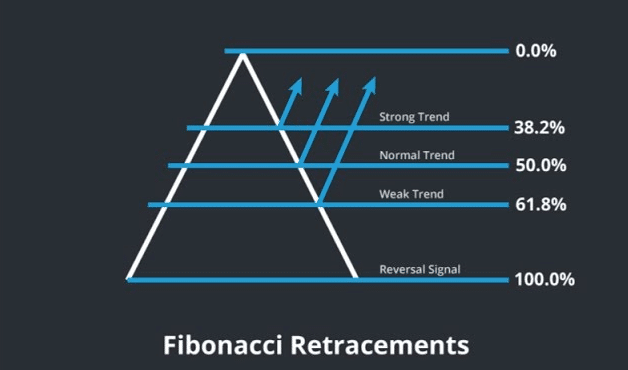
If you haven’t seen this technical indicator yet, we can assure you that you will soon enough. It consists of horizontal lines drawn on the price chart, representing different percentage levels of the Fibonacci sequence. The primary aim is to find points where the price will most likely retrace before resuming its trend.
This guide aims to explore what Fibonacci retracement in trading is and show you how to use it. Two price points form the basis of this technical indicator. With that in mind, let’s delve in and work through what Fibonacci retracement is for actual trading.
-
-
What is Fibonacci Retracement?
This technical indicator is simple to apply. While you’ll need expertise to combine and use the Fibonacci retracement with chart patterns, you can quickly apply them to any chart. The key is identifying the price points for the ratio.
The Fibonacci retracement is a popular tool but tricky to apply to a chart. Hence, you need the best stock trading apps to use it. We’ll focus on what Fibonacci retracement in trading is and the tool’s significance in trading.
Definition and Explanation of Fibonacci Retracement in Technical Analysis
Let’s begin with the Fibonacci sequence and ratios. This sequence involves numbers, where the next one is the sum of the previous two. Hence, you’ll have the following: 0, 1, 1, 2, 3, 5, 8, 13, 21, 34, etc.
The Fibonacci ratios are derived from the sequence. Hence, the Fibonacci retracement refers to static price levels on a chart using the Fibonacci ratios.
Prices begin on one level, rise or fall to another, and return to their previous level. This movement is the retracement. Therefore, we refer to it as the Fibonacci retracement since it occurs in the Fibonacci ratios.
This concept is easy to understand once you grasp the golden ratio and other Fibonacci ratios.

Overview of the Fibonacci sequence and its significance in trading
The key question is, what is Fibonacci retracement in trading? Although not used directly, the Fibonacci sequence gives rise to the ratios that produce the horizontal lines on the price charts. They are valuable for stocks, forex, commodities, oil, cryptocurrencies, etc.
Ancient India has the reputation of being the birthplace of the Fibonacci sequence. Leonardo Fibonacci, an Italian mathematician, introduced the sequence to Western Europe. Even so, Indian mathematicians beat him to the Fibonacci retracement levels.
There’s much to aid your trades, from moving averages to the Wyckoff method. However, the Fibonacci sequence has several irrefutable implications, including the following:
- Formation of retracement levels, including 50%
- Predict where prices may retrace.
- Identify possible reversal zones in price charts
Disclaimer: Don’t invest unless you’re prepared to lose all the money you invest. This is a high-risk investment and you should not expect to be protected if something goes wrong. Take 2 mins to learn more.
The Golden Ratio and Fibonacci Levels
Any discussions on what Fibonacci retracement in trading is must involve the golden ratio. This number is a convergence point derived from the Fibonacci sequence.
Understanding the Golden Ratio (1.618) and its relation to Fibonacci levels
Mathematicians discovered that the ratio of successive terms in the Fibonacci sequence tended to converge at 1.618. Hence, they termed this ratio the Golden Ratio, denoted by the Greek letter φ. The full number is 1.61803398875.
Fibonacci levels are simply percentages derived from the golden ratio or further computations. Instead of dividing the number by the preceding one, you can divide it by the succeeding numbers in the 1st, 2nd, and 3rd positions. These give different percentages that form the Fibonacci levels.
Besides doing that, you can also obtain Fibonacci levels by subtracting the golden ratio from one. It’s a simple process that aligns with the previous approach.
We’d rather have you apply this tool head-on. However, you must understand the basics and follow us through to grasp what Fibonacci retracement in trading entails.
Explaining the key Fibonacci retracement levels

The table below shows the key Fibonacci retracement levels and how to derive them:
Fibonacci levels How to derive it 23.6% You can derive it by subtracting the golden ratio from one (1 – 0.618). Alternatively, you can divide the number in the sequence by the third succeeding number. E.g., 8/34 38.2% You can calculate this ratio by dividing a number by the second succeeding number. E.g., 8/21 50% It is not directly derived from the Fibonacci sequence. However, it holds significance for price reversals and continuation. It is more psychological. 61.8% This is the golden ratio. It is derived by dividing a number by the succeeding number. 78.6% Traders refer to this ratio as the golden pocket. This level is the square root of the golden ratio. It is not directly derived from the sequence but is equally essential. Using Fibonacci Retracement to Identify Support and Resistance
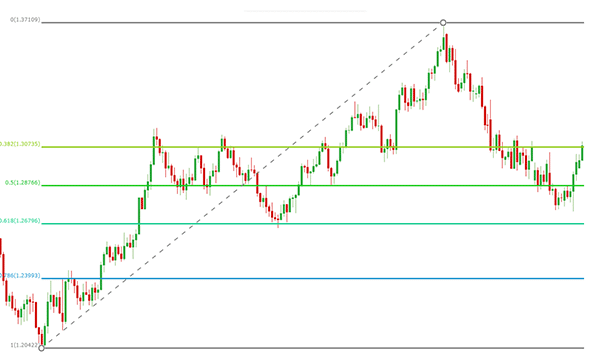
Besides knowing what Fibonacci retracement entails, one primary function is identifying support and resistance. Uptrends will have support levels, while downtrends will have resistance levels. Here’s how you can apply the Fibonacci retracement to find these levels:
Applying Fibonacci retracement to find potential support levels during uptrends
Find the most visible swing points and plot the Fibonacci retracement between them. Include all the levels mentioned above.
Support levels represent sections of a potential reversal. You’ll identify the Fibonacci level with the most support. That can hint at the price point for a complete price reversal.
The Fibonacci levels will reveal several areas of interest. Ensure you find those that hint at reversals and find the ratio that has most of them.
Identifying potential resistance levels using Fibonacci retracement during downtrends
Plotting the Fibonacci retracement during downtrends follows the reversed approach to the uptrend. Again, identify the ratio with the most resistance action. This ratio can hint at a complete reversal.
The decision on which price points to plot the Fibonacci replacement is yours. Knowing what Fibonacci retracement is completes one-half of the concept. The other half is knowing where to use the tool. We’ll address this aspect in the next section.
Disclaimer: Don’t invest unless you’re prepared to lose all the money you invest. This is a high-risk investment and you should not expect to be protected if something goes wrong. Take 2 mins to learn more.
Drawing Fibonacci Retracement Levels on Charts
You don’t pick random price points when drawing the Fibonacci retracement levels on charts. Instead, pick points that reflect the highest swings concerning the most recent price.
Fortunately, our recommended stock market research and analysis software plots all the levels. You only need two points, and the software will do the rest.
The drawing process depends on the market trend. For uptrends, you must pick the lower point and draw towards the higher point. The reverse is true if you are working with a downtrend.
Support and resistance levels will remain hidden until the Fibonacci ratios appear on the charts. This section will visualize our explanations so far. You’ll better understand them as they relate to Fibonacci retracement in trading.
A step-by-step guide to drawing Fibonacci retracement levels on price charts

For uptrends, here is a step-by-step guide to drawing the Fibonacci retracement levels:
- Register with a reputable stock-trading app. Ensure the app supports your preferred assets. You can use day trading apps or investment platforms.
- Identify the uptrend. The asset might fluctuate between uptrends and downtrends. Proceed if the most recent trend is an uptrend. Otherwise, apply the steps for downtrends.
- Determine the swing points for the uptrend. Begin at the most recent asset price and find the highest and lowest prices.
- Load the Fibonacci tool. It will be available in the drawing tools section.
- Select the low point (for an uptrend) to anchor the tool.
- Drag the tool to the high point.
- Release the mouse to apply the Fibonacci retracement
Drawing for the downtrend follows a similar process. However, you’ll anchor at the swing high and drag to the swing low.
You can adjust the retracement on some trading apps.
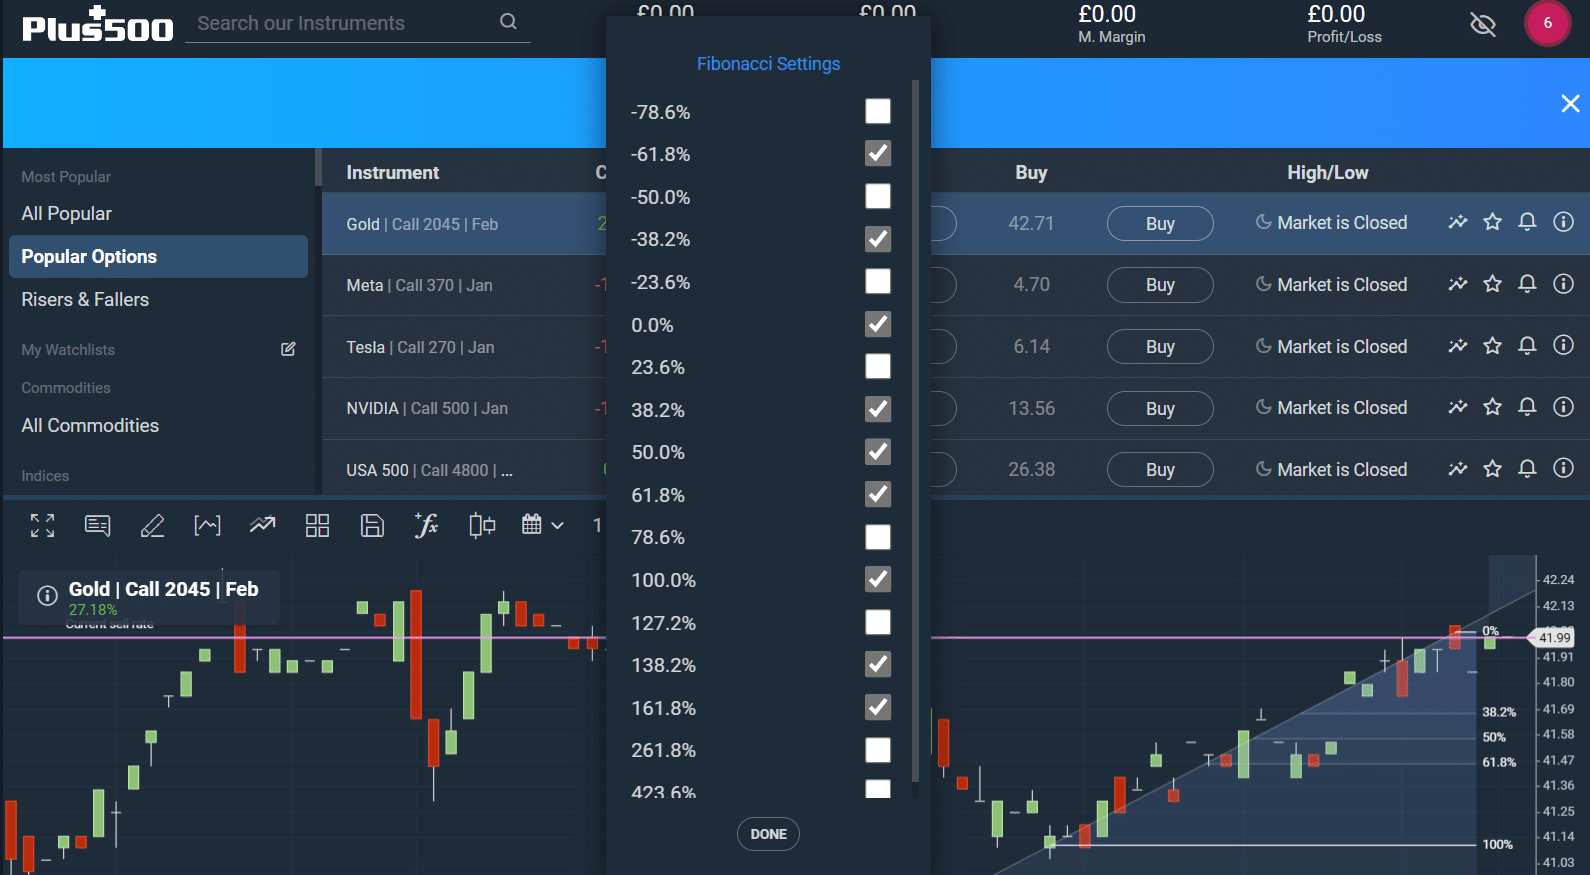
Customizing Fibonacci retracement tools on different trading platforms
What is Fibonacci Retracement Customization? Some platforms provide several customizations to give you better visuals.
Select the Fibonacci retracement to open its settings. The first thing you can customize is the color. Select your preferred colors.
The next thing you can customize is the line type. Some apps offer solid, thick, thin, and broken lines. The idea is to make the retracement as unique and visible as possible.

You can adjust the swing points as the price action continues. Most apps will have default percentages. However, you can add more or remove those you don’t need.
If available, save your new settings as the default. It will automatically apply to future retracements.
Disclaimer: Don’t invest unless you’re prepared to lose all the money you invest. This is a high-risk investment and you should not expect to be protected if something goes wrong. Take 2 mins to learn more.
What are Fibonacci Extensions?
We prepared this guide to answer the question, What is Fibonacci retracement? However, we’ve seen the need to address Fibonacci extensions. You can go beyond the current price action to predict its movement with the extensions.
Fibonacci extensions still rely on ratios, particularly the golden ratio. However, they go beyond the 100% level of the typical retracement.
Assets can have pullbacks during their uptrends. Some traders can take that as a sign to buy in or reinforce their long positions. However, uncertainty remains after the pullback.
While it’s good to stick to the basics of what Fibonacci retracement is, pullbacks are common. Hence, we’ll prepare you with an in-depth look at Fibonacci extensions.
Definition and explanation of Fibonacci extensions
Fibonacci extensions refer to the horizontal lines drawn on a price chart to predict its potential movement. They extend from the Fibonacci ratios used to assess current trends. Also, they are usable during pullbacks.
To extend, Fibonacci extensions use higher percentages. Hence, you’ll typically see 127.2%, 261.8%, and 423.6%.
These extensions combine trendlines and extension lines with retracements.
How Fibonacci extensions are used to identify price targets in trending markets
Beginners often stop at Fibonacci retracement. However, you must apply extensions to achieve better trading results.
Here’s how you can use Fibonacci extensions to identify price targets in trending markets:
- Pick three points on the chart for the start move, the end move, and the end of the retracement against the move.
- Apply the Fibonacci extension tool and pick your preferred levels
- Calculate the retracement levels. Multiply the difference between points one and two by the desired level. You’ll have a dollar amount from this calculation.
- Add the dollar amount to the price at point three if you are projecting a higher price. Subtract the dollar amount from the point-three price if you are projecting a lower price.
Fibonacci Extension Levels
You’ve seen what Fibonacci retracement ratios are. Now, we must examine the vital extension ratios.
Understanding key Fibonacci extension levels
The vital Fibonacci extension levels include the following:
-
- 127.2%: Identify the high and low price of the move and calculate their difference. Multiply that value by 1.272. Then, add the result to the high price of the move to get 127.2%.
- 161.8%: use the same formula as above
- 261.8%
- 423.6%
You must get the background Fibonacci retracement before aiming for the extensions.
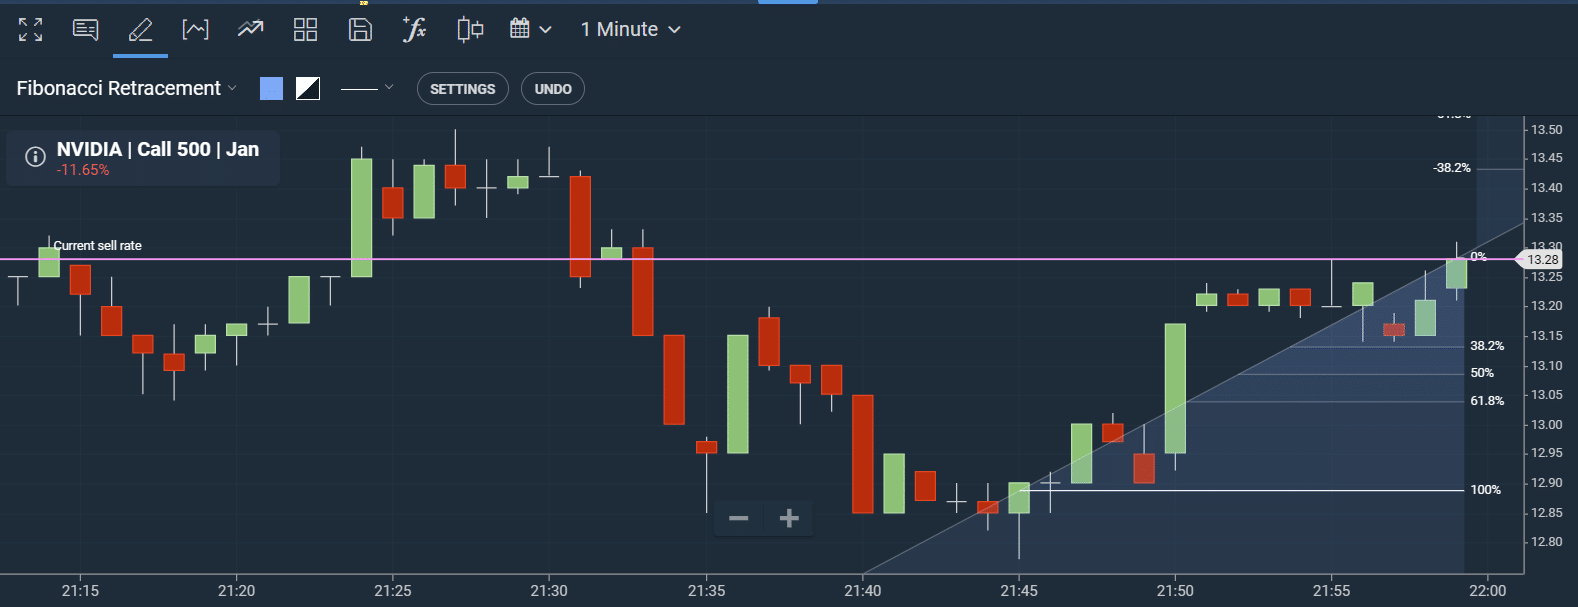
Examples of Fibonacci extension levels in real-world trading scenarios
The price movement below belongs to an actual stock. Let’s assume $12.89 and $13.28 as the low and high points for our price action.

The 127.2% = $13.28 + [(13.28 – 12.89) * 1.272]
= $13.77
161.8% = $13.28 + [(13.28 – 12.89) * 1.618]
= $13.911
Disclaimer: Don’t invest unless you’re prepared to lose all the money you invest. This is a high-risk investment and you should not expect to be protected if something goes wrong. Take 2 mins to learn more.
Fibonacci and Chart Patterns
We’ve explored what a Fibonacci retracement is extensively. You’ve seen how to read and use the retracement levels as support or resistance. Notwithstanding, you can combine this tool with different chart patterns.
Combining Fibonacci retracement with common chart patterns
Prominent chart patterns include the head and shoulders, triangles, flags, and double tops/bottoms. Here’s how you can combine the Fibonacci retracement with different patterns:
Combination with the head and shoulder pattern
Do the following:
- Identify the chart pattern and plot the Fibonacci retracement
- Find areas where the Fibonacci levels align with the head and shoulder chart pattern
- These areas can be potential price targets
Combination with a triangle pattern
Triangle patterns can be ascending, descending, or symmetrical. The areas where the Fibonacci levels align with the pattern can signify potential price targets.
Using Fibonacci to confirm or invalidate chart pattern signals
What is a Fibonacci retracement in chart pattern validation? You can use the tool to confirm pattern signals.
Fibonacci levels can align with breakout, support, or resistance levels. When that happens, it signifies strong trends or signals. You can consider the signal weak if the Fibonacci levels do not align.
Fibonacci Retracement and Trend Analysis
Now, we must move on to what a Fibonacci retracement brings to trend analysis. Invariably, you can use this tool with trendlines to identify confluence points.
Using Fibonacci retracement in conjunction with trendlines
Check if the Fibonacci retracement aligns with the trendlines. Those confluence points can point to support or resistance, depending on the trend.
Use multiple frames and forecast with the Fibonacci extensions. Adjust the parameters until you get the best signals.
Enhancing trend analysis with Fibonacci levels
Your understanding of price swings can improve with Fibonacci levels. These can identify support or resistance and even predict future price movements.
Expand your analysis by including Fibonacci extensions, multiple timeframes, and other technical indicators.
Limitations of Fibonacci Retracement
Factors affecting the reliability of Fibonacci levels
The primary factors that affect reliability include the following:
- The timeframe for the test (the period between the price swings)
- The market environment
- The difficulty of the asset
- The trading volume
Instances where a Fibonacci retracement may not work effectively
As per our answer to what a Fibonacci retracement is, informing you about its limitations is prudent. These include the following:
- The tool will be unreliable in sideways markets
- You might not get enough price swings in low-volatile markets
- High volatility might make the tool ineffective
- The tool will be unreliable if the market is susceptible to external manipulation.
Disclaimer: Don’t invest unless you’re prepared to lose all the money you invest. This is a high-risk investment and you should not expect to be protected if something goes wrong. Take 2 mins to learn more.
Risk Management with Fibonacci Retracement
Our final lap on this Fibonacci retracement guide falls on risk management. The endpoint of all technical indicators is to make better trade decisions.

Here’s how you can manage risk when trading with the Fibonacci retracement:
Implementing proper risk management when using Fibonacci retracement
Set stop-loss and take-profit limits on your portfolio while trading. Do not overleverage your positions.
Avoiding common mistakes and biases in interpreting Fibonacci levels
The typical mistakes you should avoid include the following:
- Using Fibonacci levels as standalone tools
- Using different reference points for the levels
- Omitting stop-loss orders when taking long or short positions
- Combining the tool with other indicators wrongly
Trading with Fibonacci Retracements: The eToro Complete Guide
You’ve learned enough about what a Fibonacci retracement is to get you started. However, we recommend eToro as our top trading platform.
eToro is available in many financial markets. Here’s how to start trading with the app:
 Step 1: Register with eToro
We recommend registering through the app or mobile website. To download the app, use the links available on the homepage.
Step 2: Verify your accountProvide the needed details to open a new account. You can register through the website or app. Also, you can register with your Facebook or Gmail account.
Enter the email verification code to complete the initial registration. Then, you can submit the necessary documentation to verify your full account.
Step 3: Practice with the virtual portfolioUse eToro’s virtual portfolio to learn more about the Fibonacci retracement. Explore different markets and assets while learning.
Step 4: Fund your real-money accountGo to the deposit page and select credit cards as your preferred payment option. Deposit the amount you want and warm up for real trades, gains, and losses.
Step 5: Start trading real assetsNew players should practice with the demo. Professionals can quickly begin trading with real money.
What is a Fibonacci Retracement? – Conclusion
The question of what a Fibonacci retracement is has evolved to be about the best way to apply and combine this tool with other indicators. You can use it to identify support and resistance levels. The Fibonacci extensions can also provide price predictions.
Manage risks and trade within your budget. Use eToro for a seamless trading experience on your mobile device.

Disclaimer: Don’t invest unless you’re prepared to lose all the money you invest. This is a high-risk investment and you should not expect to be protected if something goes wrong. Take 2 mins to learn more.
References
https://corporatefinanceinstitute.com/resources/wealth-management/asset-allocation/
https://fortunly.com/articles/risk-management-in-trading/
https://www.fortunebusinessinsights.com/online-trading-platform-market-104934
https://www.forbes.com/sites/brettsteenbarger/2021/01/08/mastering-your-trading-psychology/
https://edition.cnn.com/2022/10/21/investing/premarket-trading-stocks/index.html
FAQs
How do you use Fibonacci retracement for beginners?
The key to using this tool is knowing the Fibonacci levels to apply. Then, you must pick the most noticeable price swings to find the price points for the retracement.
What is the golden rule of Fibonacci retracement?
The golden ratio of Fibonacci retracement is 1.618. All ratios between two adjacent numbers in the Fibonacci sequence tend to converge on this number.
Is Fibonacci retracement a good indicator?
This tool is valuable for identifying support and resistance levels in price movements. However, combine it with other tools for a more rounded trading decision.
How does Fibonacci retracement work?
This tool works by picking two opposite price points (high and low) and dividing them according to the Fibonacci ratios.

Jeremiah Awogboro

Jeremiah Awogboro
View all posts by Jeremiah AwogboroJeremiah Awogboro is an experienced content writer with over 8 years of experience. He has a qualified MBChB degree and a keen interest in the stock market and the finance industry. His background in the industry has provided him with valuable experience in this field. Awogboro is dedicated to assisting and reaching out to as many people as possible through his writing. In his spare time, he enjoys music, football, traveling, and reading.

eToro: Overall Best Stock App with 0% Commission
VISIT ETOROYour capital is at risk. Other fees apply. For more information, visit etoro.com/trading/fees.stockapps.com has no intention that any of the information it provides is used for illegal purposes. It is your own personal responsibility to make sure that all age and other relevant requirements are adhered to before registering with a trading, investing or betting operator. Contracts for Difference (“CFDs”) are leveraged products and carry a significant risk of loss to your capital. Please ensure you fully understand the risks and seek independent advice.By continuing to use this website you agree to our terms and conditions and privacy policy.
Trading is risky and you might lose part, or all your capital invested. Information provided is for informational and educational purposes only and does not represent any type of financial advice and/or investment recommendation.
Crypto promotions on this site do not comply with the UK Financial Promotions Regime and is not intended for UK consumers.
© stockapps.com All Rights Reserved 2026