Wyckoff method explained – Trading Strategy Guide 2026

We should take any trading strategy that began in the 20th century and has survived up until today seriously. While it is not a 100% success guarantee, many traders continue to use it, prolonging its longevity. The Wyckoff method explained holds a hidden gem of market phases essential to predictions.
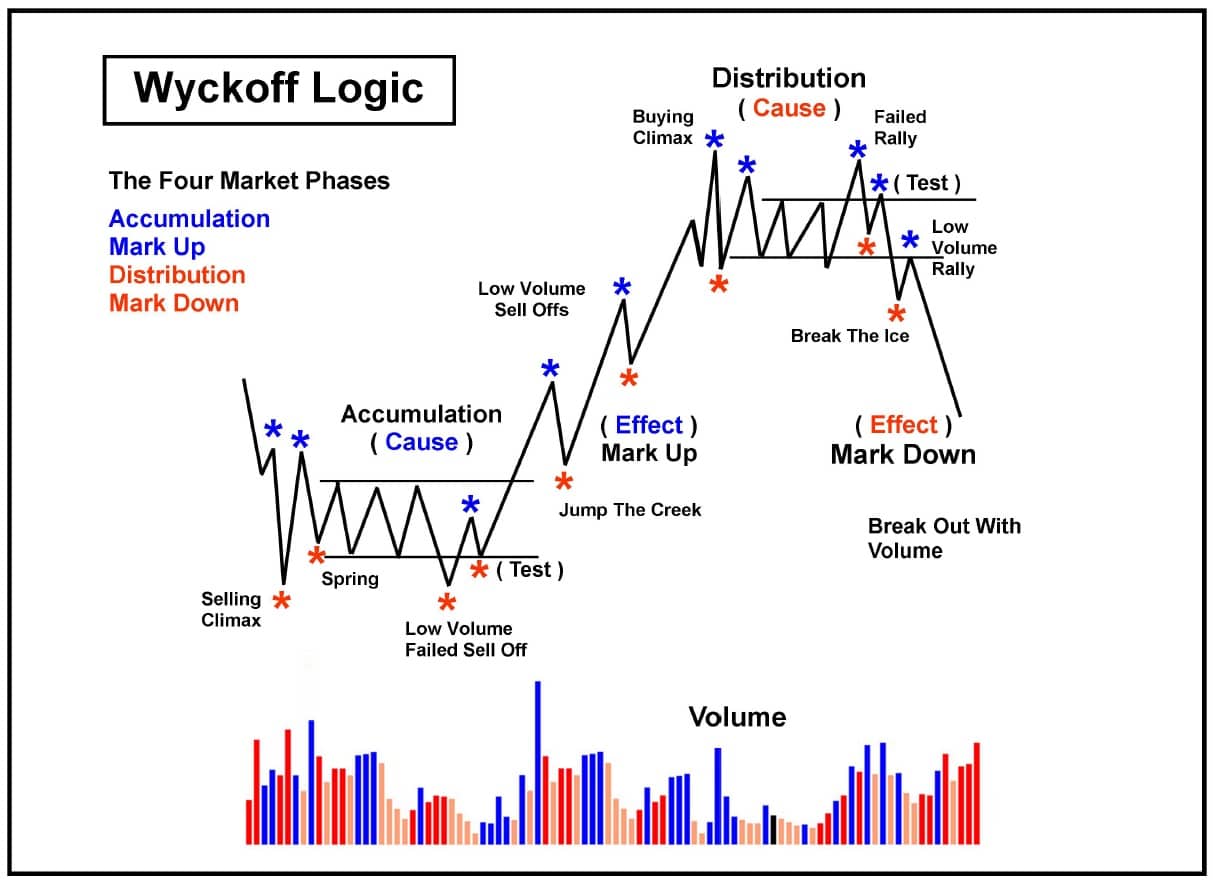
According to this method, a market cycle has four distinct phases: markdown, accumulation, markup, and distribution. The Wyckoff method explained that these phases continue repeatedly as trading continues. Furthermore, these phases contain opportunities to sell or buy.
The “Wyckoff method explained” believes that volume trends play a significant role in the market cycle. We’ll explore all the phases and integral features of this trading approach. You’ll also learn how to use it to identify entry and exit points.
-
-
What is the Wyckoff Method?
Most expert traders have charts and patterns they turn to before making weighty decisions. Some employ a variety of technical tools and indicators. The primary purpose is to predict the market as accurately as possible.
While we have AI stock picking and predictions today, technical analysis is at the core of expert trades. Richard Wyckoff is one of the pioneers of technical analysis.
Overview of Richard D. Wyckoff and his contributions to technical analysis
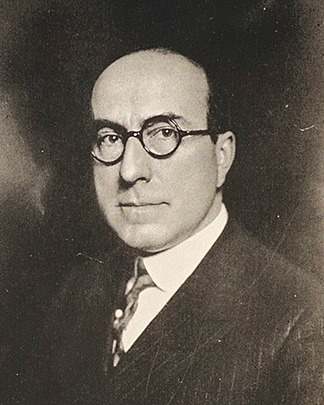
The five titans of technical analysis include Dow, Gann, Elliot, Merrill, and Richard Wyckoff. Traders in the early 20th century fell back on best practices to navigate the market. Richard Wyckoff compiled these best practices into laws and trading techniques.
While he lived from 1873 to 1934, his techniques have stood the test of time. Today, his method applies to freely traded markets with large institutional traders, like banks. These markets include stocks, commodities, currencies, etc.
Besides developing the “Wyckoff method explained,” Richard was a proponent of mental discipline. The market requires as much mental discipline as it does technical analysis.
Definition and core principles of the Wyckoff Method
Trends may not be the same, but demand and supply drive markets. The Wyckoff method explained is a technical-based approach that focuses on changing buyer and seller power to predict price movements. Traders can identify several patterns on their charts and use them to buy, sell, or hold.
This approach proposes a five-step process to select stocks and entry points. They are as follows:
- Determine the present market trend and its probable future
- Select stocks that harmonize with the trend
- Determine the asset’s readiness to be bullish
- Determine the asset’s price objectives
- Determine the asset’s risk
The “Wyckoff method explained” uses specific price movements to identify the accumulation and distribution phases. Of course, one phase must give way to another. Hence, Wyckoff introduces the spring and upthrust patterns to tell when the market gears up for a shift.
Volume trends are essential when identifying market phases. For example, a stock is in its accumulation phase if trading volume increases while the price decreases or goes sideways. Fortunately, today’s day-trading apps have volume indicators to ease the analysis.
Disclaimer: Don’t invest unless you’re prepared to lose all the money you invest. This is a high-risk investment and you should not expect to be protected if something goes wrong. Take 2 mins to learn more.
Why is the Wyckoff Method popular?
You’d think this approach would give way to a refined modern technique. However, the reverse is the case. The trading approach of identifying phases and trends, as the Wyckoff method explained, remains popular among expert traders.
We don’t recommend this technique to beginners. Nonetheless, you can learn and practice with a demo account.
Historical significance and evolution of the Wyckoff Method

Wyckoff focused on the relationship between volume and price. He also did extensive work on the supply-and-demand relationship. This approach gave birth to modern chart analysis and market psychology.
Two significant rules we use today can be traced back to this titan. They are as follows:
- The market and individual stocks will never repeat the exact same movement twice
- We can only understand price movements by comparing them to past behavior
Wyckoff’s experience identified the up, down, and side trends with short-, intermediate-, and long-term timeframes. This thought has aided in the development of modern trading techniques. The Triple Screen Method from Alexander Elder is a prominent example.
Comparison with other technical analysis approaches
The table below compares the Wyckoff method explained with other technical analysis approaches:
Wyckoff Method Dow Theory Japanese Candlestick Analysis Predicts through volume and price dynamics and supply and demand relationship Uses broader trends and sentiments Uses candlestick patterns with market psychology It can be applied to different timeframes It is often suited to short-term trades Accumulation Phase
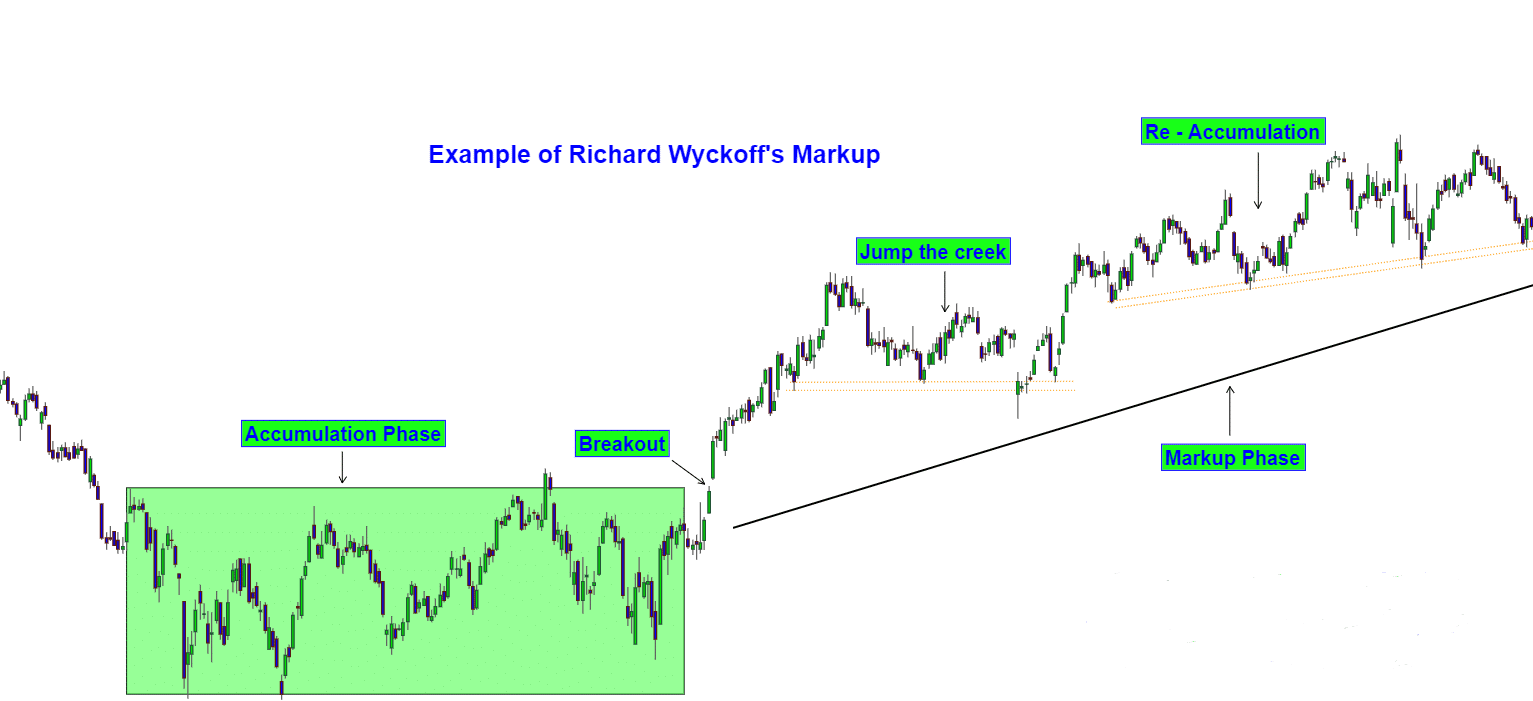
We’ve reached the first significant phase of the Wyckoff method explained. The accumulation phase is when buyers begin to take orders. It occurs after a markdown or downtrend.
Characteristics of the accumulation phase
The following are the characteristics of the accumulation phase:
- The price movement is sideways, showing decreased momentum
- Trade volume drops before increasing, even when the price is stable
- There will be a period of sharp price increase with low trading volume
- Several support levels occur
- Sellers’ power reduces, and buyers’ power increases
- A spring pattern that may signal the end of the accumulation phase
You can identify most of these characteristics on the Wyckoff chart. Using stock trading signals can be helpful to avoid missing out on crucial points like the spring.
Identifying signs of institutional accumulation
Often, the public will have little interest during the accumulation phase. However, this phase allows large institutional traders to build their positions. They do this by shaking out smaller traders without a further price decline.
The “Wyckoff method explained” shows several signs that indicate institutional accumulation. They include the following:
- An increase in trading volume, which signifies that large investors are buying assets,
- The prices stabilize and move sideways, showing that supply and demand are in equilibrium
- Narrow price spreads may occur daily. That shows that buyers are willing to pay more.
- Prices may begin rising to indicate demand outweighing supply
- The market repeatedly tests support levels
- Sudden increases in volume and price

Markup Phase
This phase links the accumulation and distribution phases. It occurs after accumulation and strong price increases. To experts, this phase is the opportunity to buy, as they are confident of an upward trend.
Understanding the markup phase and its indicators
Assets can break out of resistance levels and go on a strong upward trend. However, breakouts don’t always lead to upward trends. Accelerating trends may mislead.
Higher highs and higher lows after a price breakout are good indicators of the markup phase. You can also use the average directional index (ADX) to identify the beginning of the markup phase. An ADX above 25 can signify a trending asset.
Other indicators you can use as the Wyckoff method explained include sustained upward price momentum, higher trading volume with increased prices, support at moving averages, etc.

Recognizing price patterns during the markup phase
The following price patterns occur during the markup phase:
- Price spreads widen, and volume increases
- The price moves to the top of the trading ranges
- Prices resume upward trends after quick pullbacks
- Engulfing bullish candlestick patterns will occur
- Moving averages provide support for the prices
- Overbought signals from the RSI and other indicators
Disclaimer: Don’t invest unless you’re prepared to lose all the money you invest. This is a high-risk investment and you should not expect to be protected if something goes wrong. Take 2 mins to learn more.
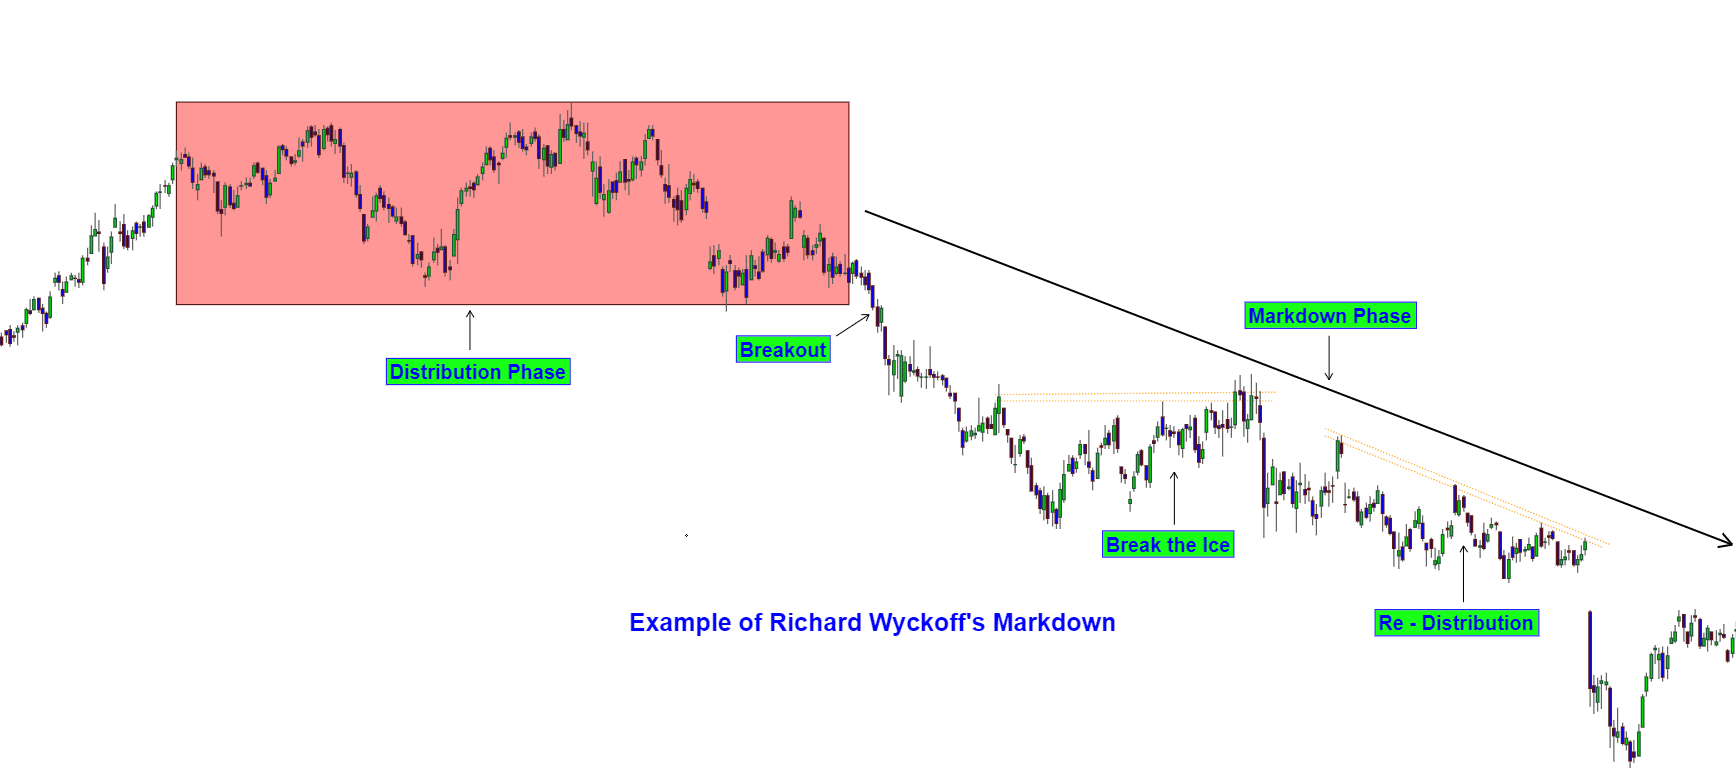
Distribution Phase
During this phase, the price completes its upward trend and loses momentum. It eventually settles into a sideways movement. You can identify it when the asset fails to generate new highs.
As the Wyckoff method explained, this phase resembles the accumulation phase. Again, demand and supply remain in equilibrium.
Features of the distribution phase
The features of the distribution phase include the following:
- Resistance forms at specific levels, stopping prices from advancing
- Fake breakouts may occur above the resistance
- It often begins with strong sales and high volumes.
- Volatility increases as traders hasten to sell their assets
- Market sentiment becomes cautious.
- Support levels break down following selling pressure
Identifying signs of institutional distribution
You can quickly identify institutional distribution with the Wyckoff method explained. Look towards the volume as the price moves. If the volume decreases, it shows declining interest and momentum.
Other signs include:
- Failed breakouts above resistance levels
- Shooting stars and evening stars (candlestick patterns)
- Selling pressure is sustained as supply outweighs demand
- Minor downtrends
Markdown Phase
This downtrend occurs after the distribution phase. Selling pressure increases, resulting in price declines. Also, prices fall more quickly than they did during the markup phase.
Overview of the markdown phase
Traders with assets want to sell them off to avoid losses. However, fewer buyers are interested because of the declining momentum and prices. This drives prices down.
During the markdown phase, trading volume increases while the price falls. Limited rallies may occur, but the trend remains downward. Moving averages can take up resistance as support levels break down.

Recognizing price patterns during the markdown phase
You can quickly recognize the markdown phase for its strong downward trend. Resistance forms at former support levels, even as selling pressure continues. If you prefer candlestick patterns, look for the hanging man or bearish engulfing patterns.
Wyckoff Schematic and Chart Patterns
The “Wyckoff method explained” schematic and chart patterns form the basis of this technical analysis. You can overlay them on real trades to see your current phase. However, consider the short, medium, and long-term timeframes.
Explaining the Wyckoff schematic
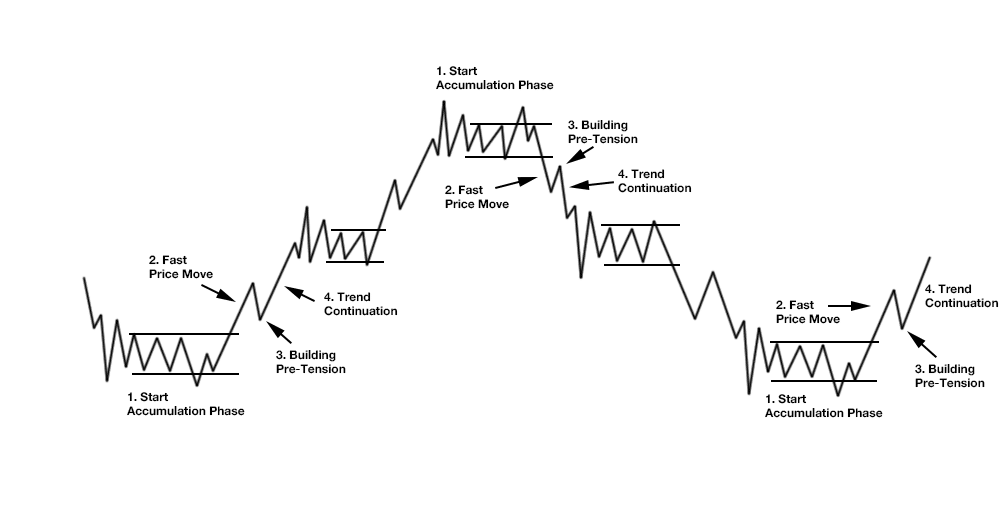
According to the “Wyckoff method explained,” price movements boil down to the accumulation and distribution phases. These, with the markup and markdown phases, form the market cycle, which repeats.
The Wyckoff schematic shows the supply and demand dynamics. It also shows how price relates to volume in different market conditions.
Common chart patterns used in the Wyckoff Method Explained
Several chart patterns occur in the Wyckoff method explained. We’ve covered the accumulation and distribution phases as the primary patterns. Other patterns include the following:
- Spring pattern: This forms a false break. However, it stays below the support level. A quick recovery often follows this false break.
- Upthrust: The prices rise above the resistance level but quickly reverse. It often indicates the beginning of the distribution phase.
- Sign of strength: This pattern shows a price advance with an increasing spread. The volume is relatively high, often occurring after spring.
- Sign of weakness: The SOW is a downward trend towards the trading range lower boundary. High spread and volume often accompany it.
- Test: This pattern occurs after a breakout. It shows range-bound trading with sideways movement.
Disclaimer: Don’t invest unless you’re prepared to lose all the money you invest. This is a high-risk investment and you should not expect to be protected if something goes wrong. Take 2 mins to learn more.
Volume Analysis
You can predict the accumulation and distribution phases better with the trading volume. Supply and demand may control the prices, but the volume indicates market interest.
Role of volume in the Wyckoff Method
According to the Wyckoff method explained, uptrends are not the only time for increased volume. Range-bound trades can also have increased volume.
You can use volume in the following ways:
- During range-bound trading after downtrends, increased volume indicates increased interest (accumulation)
- An increased volume during distribution with sideways prices shows falling interest.
Interpreting volume patterns to confirm price movements
Price movements can be misleading. Hence, you must always use volume to confirm the trends. Low volumes during sideways price movements after a downtrend show no sign of reversal.
Don’t look at the schematics and believe prices will always move according to the graph. Use trading volumes to gauge interest and market sentiment.
Wyckoff Method for Market Analysis
You can use the Wyckoff method for different timeframes. Using it requires an adequate grasp of technical indicators and analysis.
A step-by-step approach to analyzing markets using the Wyckoff Method
Here is a step-by-step approach to market analysis with the Wyckoff method explained:
- Identify the phase using the trend, price movement, and volume
- Identify support and resistance levels
- Examine the highs and lows to reveal trends
- Look out for springs or upthrusts (confirm with volume)
- Incorporate candlestick patterns like engulfing bullish and bearish patterns
- Use volume to gauge market sentiment
Applying Wyckoff principles to different timeframes
Short timeframes require quick decisions, especially during intra-day trades. Look for smaller support levels for the accumulation phase or resistance levels for the distribution phase. Both require you to pull back and examine the price movement a bit longer.
Adjust the moving average and other indicators to match your timeframe. Overall, use volume to back up your predictions.

Wyckoff Method for Entry and Exit Strategies
Identifying entry points based on Wyckoff analysis
Entry should come after the accumulation phase. Of course, you should be sure the price will enter the markup phase. Several breakouts may occur, but be wary of them.
For long positions, we recommend entering after the spring. Buy when the price goes above the support level.
Short positions should come after the distribution phase. Enter the position as the price begins to decline.
Implementing stop-loss and take-profit levels in Wyckoff-based trading
Stop-loss and take-profit are tools to help minimize losses. You can use them during the accumulation and distribution phases.
For stop losses, set them below the support level during the accumulation phase and above the resistance level for the distribution phase. Take-profit levels can come in during markup phases. Use logical resistance points.
Disclaimer: Don’t invest unless you’re prepared to lose all the money you invest. This is a high-risk investment and you should not expect to be protected if something goes wrong. Take 2 mins to learn more.
Limitations of the Wyckoff Method
The Wyckoff method is not foolproof. There are limitations you should always consider when making significant investments.
Factors that may affect the accuracy of Wyckoff analysis
The following factors can influence the accuracy of the Wyckoff analysis:
- Sudden developments: News or sudden events can cause unexpected reversals. For example, a scandal can cause a company’s stock to drop as buyers boycott it.
- Market manipulation: Large institutions can manipulate the market by increasing or decreasing liquidity.
- Relatively low volumes: Using Wyckoff analysis with low volumes can be challenging.
- Timeframe signals: Short- and long-term can yield different signals.
- Data quality: Use the best stock market research and analysis software for good data quality.
- High volatility: Wyckoff analysis can be less effective in highly volatile conditions.
Situations where the Wyckoff Method may not be suitable
We don’t recommend this method in the following situations:
- Highly volatile markets
- News-driven stock markets
- Poor technical analysis skill levels
- Too few data points for observation
Criticisms and Controversies
Critiques from the trading community
Many traders still regard the Wyckoff method as too complex. In today’s AI era, most traders turn to AI platforms for analysis. Hence, they have little grasp of the method.
Other traders argue that the method is suitable for stocks alone. Hence, it has little applicability to other areas. Identifying the patterns before trades occur can be challenging.
Addressing common misconceptions about the Wyckoff Method
The most common misconception about this method is that it is a prediction tool. That is the opposite of what it does. Moreover, you can only get the chart after the price movement has occurred.
Another misconception is that you can use it as a standalone trading strategy. You should be versed in other strategies and technical analysis.
How to Trade the Wyckoff Method: eToro Complete Guide
You’ll understand the Wyckoff method better once you use it. For that, we recommend eToro for your online trading needs. This online broker offers technical tools that will be valuable additions to the Wyckoff method.
Note: Only cryptocurrencies eToro customers in the United States will be able to trade on the platform will be Bitcoin, Bitcoin Cash, and Ethereum.
Here’s how to get started with eToro:
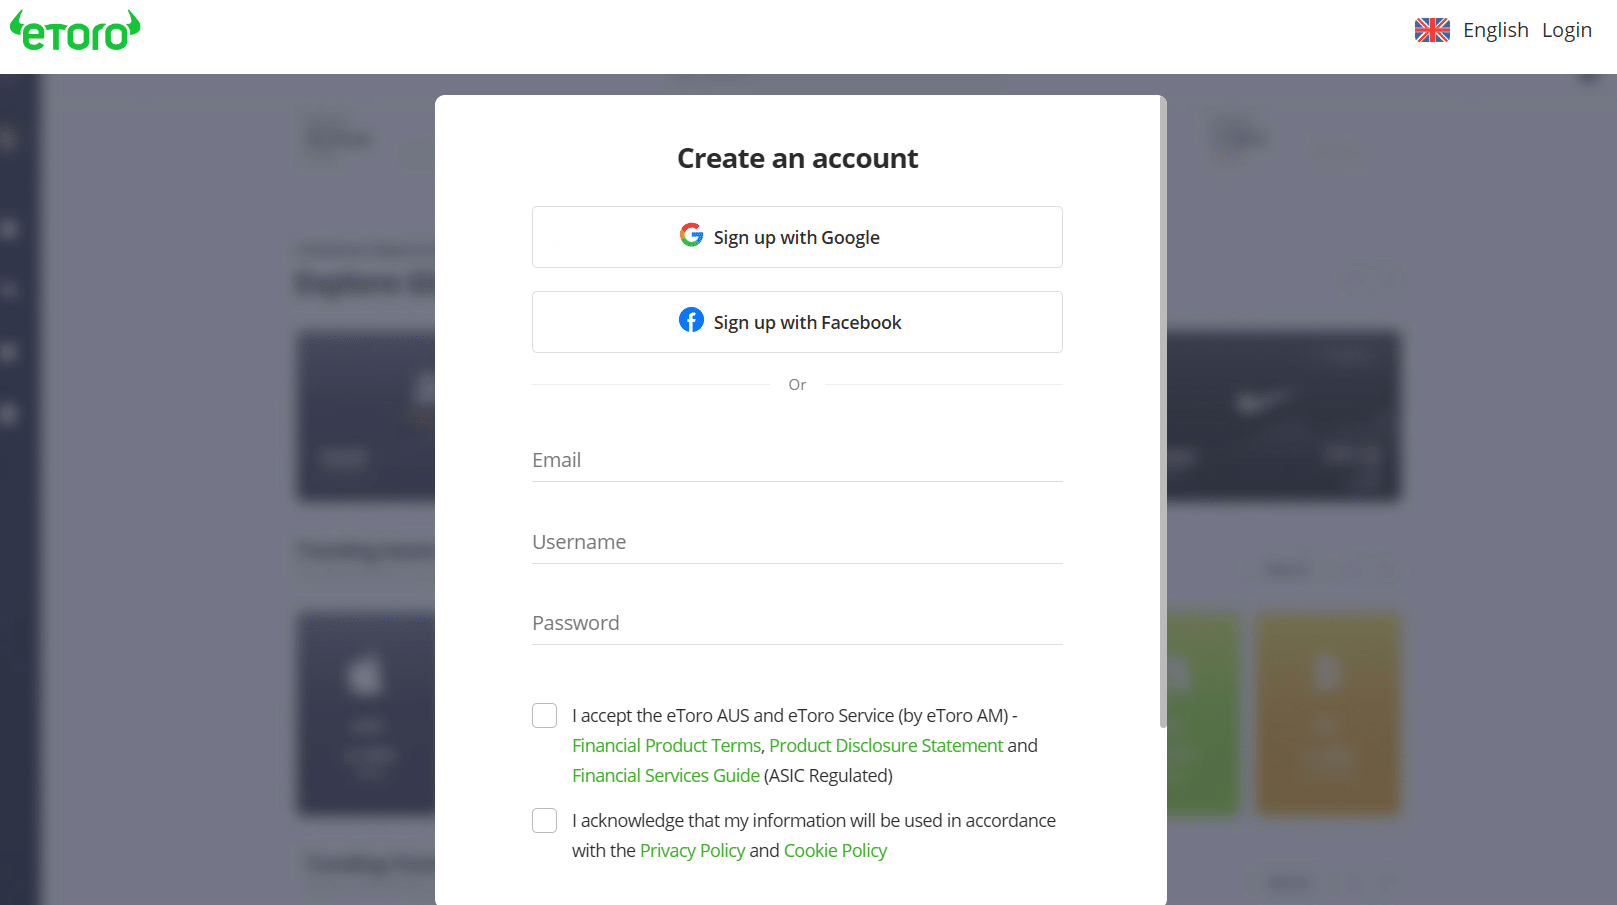
 Step 1: Register on the website
You need a registered account to use eToro’s services. Go to the website and click to join as a new trader. Fill out the registration form or register through your Gmail or Facebook accounts.
Step 2: Verify your accountYour account will be inaccessible until you verify it. Click “Send Code” to receive the verification code in your email. Fill in the code in the box provided to complete the verification.
Step 3: Download the app to trade on your smartphoneeToro has mobile applications for iOS and Android users. Go to the homepage and click the appropriate link. Download and install the app on your mobile device.
Log in with your account details.
Step 4: Fund the new accountYou need money to trade on eToro. Go to the deposit page and input your credit card details. Enter the amount you want to deposit and confirm the transaction.
Depending on your security features, you might need a one-time password to continue.
Step 5: Start tradingGo to the trading dashboard and scan for assets. You can type the asset’s ticker symbol for a quick search.
The Wyckoff Method Explained: Conclusion
Markets are unique. However, the Wyckoff method helps identify the accumulation and distribution phases, which are key to entering or leaving the market. You can get more accurate results by pairing this method with other technical indicators, like moving averages.
Use eToro to trade stocks and other commodities, including cryptocurrency.

Disclaimer: Don’t invest unless you’re prepared to lose all the money you invest. This is a high-risk investment and you should not expect to be protected if something goes wrong. Take 2 mins to learn more.
References
- https://www.elcomblus.com/corporate-scandals-and-the-stock-market/
- https://www.thebalancemoney.com/essential-trading-psychology-books-1031445
- https://edition.cnn.com/markets/fear-and-greed
- https://smartasset.com/retirement/bucket-strategy-asset-allocations
- https://www.nytimes.com/2022/01/25/business/stocks-hold-or-sell.html
FAQs
How do you use the Wyckoff method?
The Wyckoff method identifies springs and upthrusts, which help pick entry and exit points. You can use its price-volume dynamics to gauge market sentiment.
Is Wyckoff method effective?
It is effective in identifying the best entry and exit points and predicting market sentiment.
What is the 3 Law of Wyckoff?
This is the law of effort vs. result. It identifies convergence and divergence in price-volume dynamics to determine potential reversal points.

Jeremiah Awogboro

Jeremiah Awogboro
View all posts by Jeremiah AwogboroJeremiah Awogboro is an experienced content writer with over 8 years of experience. He has a qualified MBChB degree and a keen interest in the stock market and the finance industry. His background in the industry has provided him with valuable experience in this field. Awogboro is dedicated to assisting and reaching out to as many people as possible through his writing. In his spare time, he enjoys music, football, traveling, and reading.

eToro: Overall Best Stock App with 0% Commission
VISIT ETOROYour capital is at risk. Other fees apply. For more information, visit etoro.com/trading/fees.stockapps.com has no intention that any of the information it provides is used for illegal purposes. It is your own personal responsibility to make sure that all age and other relevant requirements are adhered to before registering with a trading, investing or betting operator. Contracts for Difference (“CFDs”) are leveraged products and carry a significant risk of loss to your capital. Please ensure you fully understand the risks and seek independent advice.By continuing to use this website you agree to our terms and conditions and privacy policy.
Trading is risky and you might lose part, or all your capital invested. Information provided is for informational and educational purposes only and does not represent any type of financial advice and/or investment recommendation.
Crypto promotions on this site do not comply with the UK Financial Promotions Regime and is not intended for UK consumers.
© stockapps.com All Rights Reserved 2026