Crypto Trading Chart Patterns Overview – All You Need to Know

Trading cryptocurrency can seem unpredictable without a solid strategy. Understanding chart patterns is an important skill that helps crypto traders recognize repeating price action patterns and trading opportunities to profit. This crypto trading chart pattern overview aims to provide clarity amidst the chaos.
Chart patterns are visual formations that appear on OHLC charts over time. Continuation patterns like flags and pennants signal that the overall trend should continue. Reversal patterns like head and shoulders indicate potential trend changes. Spotting and interpreting these patterns early is essential for timing entries and exits.
In this article, you will understand what chart patterns are and learn to recognize key patterns like flags, triangles, double tops/bottoms, and more. You’ll know how to incorporate patterns into a complete trading plan with indicators and risk management. With this comprehensive crypto trading chart pattern overview, you’ll boost profits using time-tested techniques.
-
-
Understanding Technical Analysis in Cryptocurrency Trading
Before we delve fully into our crypto trading chart patterns overview, it’s important to understand what technical analysis is. Technical analysis is the practice of studying historical price charts, volume, and patterns in the crypto market to identify trading opportunities.
Rather than attempting to predict future price movements, technical analysts focus on analyzing current and past price dynamics to spot recurrent behaviors and tendencies with chart patterns.
Role of Technical Analysis in Trading
The majority of cryptocurrency traders rely more heavily on technical analysis than fundamental analysis. Crypto prices often react more strongly to technical indicators and chart patterns than to news events or financial statements. Therefore, reading candlestick charts, indicators, and crypto trading patterns gives traders an analytical edge.

Technical analysis empowers traders to make pragmatic trading decisions anchored in actual real-time market conditions rather than speculation. By recognizing historical chart patterns, support, and resistance levels, traders can reliably identify areas of buying/selling pressure, breakouts, reversals, and overall market momentum. Technical analysis provides the clarity needed to filter out market noise.
Benefits of Using Chart Patterns
Crypto trading patterns capture repeating price action that embeds valuable insights into market psychology and behaviors. These visual structures on the price chart enable traders to objectively determine optimal entry points, stop loss levels, price targets, and overall market direction.
Mastering the recognition of high-probability crypto trading patterns takes screen time and practice but it pays off tremendously. Each correctly identified chart pattern represents a potential opportunity to enter a trade aligned with the market’s momentum early on, right before a major price swing or breakout. Moreover, combining chart patterns with technical indicators gives further confirmation of the validity of a pattern and directional bias.
Growing one’s pattern recognition capabilities progressively strengthens a trader’s skills in spotting upcoming moves early on. Reliably identifying crypto trading patterns early allows traders to strategically prepare and capitalize before the rest of the market reacts. Thus, competency in trading with chart patterns creates a valuable competitive edge.
Disclaimer: Don’t invest unless you’re prepared to lose all the money you invest. This is a high-risk investment and you should not expect to be protected if something goes wrong. Take 2 mins to learn more.
What are Trading Chart Patterns?
Before we go further into the crypto trading chart patterns overview, let’s look at what chart patterns are and why they are important.
Definition and Importance
Crypto trading chart patterns are visual price structures that form on the charts over time as price action consolidates and continues trends. These patterns emerge across all timeframes and cryptocurrencies, signaling high-probability trading opportunities. Understanding chart pattern analysis is key for timing entries and exits.
Chart patterns owe their importance to the repeatable nature of human emotions and behaviors in the markets. As optimism and pessimism around crypto assets swing from one extreme to another, they get imprinted on the price chart as patterns. Seasoned traders can decode these emotional cycles using chart patterns.
Role of Price and Volume in Chart Patterns
The formation, evolution, and eventual breakout or breakdown of crypto trading patterns depend on the price level and trading volume within them. The high volume highlights conviction among market participants at each stage. Volume confirmation is essential for assessing the validity of patterns.
Common Types of Chart Patterns
There are two major categories of crypto trading chart patterns: continuation and reversal patterns. Both types provide trading opportunities but differ in signals about market direction. Let’s explore both of them in this crypto trading chart pattern overview.
The table below compares the types of chart patterns:
Continuation patterns Reversal patterns Suggests that the ongoing trend will resume and persist after a brief consolidation or pause signal that the trend is likely to stall and reverse include flags, pennants, and symmetrical triangles Head and shoulders, as well as double tops and bottoms, are examples of reversal patterns best used by traders already in a position, indicating further entry opportunities present trading opportunities even without existing exposure to the asset Disclaimer: Don’t invest unless you’re prepared to lose all the money you invest. This is a high-risk investment and you should not expect to be protected if something goes wrong. Take 2 mins to learn more.
Definition and Characteristics of Continuation Patterns
Continuation patterns reflect a temporary pause in the existing trend before further movement in the same direction. They act as short breaks within a larger, more sustained uptrend or downtrend. Continuation patterns apply the market adage, “The trend is your friend.”
Identifying Ongoing Trends
During strong crypto uptrends or downtrends, trading chart patterns will eventually form as short-term profit-taking induces some consolidation. The overall trend remains intact despite these healthy pullbacks along the way. Traders should avoid considering this as trend weakness or reversal signals prematurely.
Crypto trading patterns like flags, pennants, and symmetrical triangles belong to the continuation family and have distinct characteristics. The slope or shape of these patterns, along with volume changes at each leg, provides insights into the energy of existing trends. Analyzing these visual structures offers objective means to stay aligned with momentum.
Role of Consolidation in Continuation Patterns
The consolidation witnessed during continuation patterns is marked by narrowing volatility and decreasing trading volumes. This reflects the market’s indecision and equal push-pull dynamics before a breakout. Being able to distinguish this phase objectively is key to anticipating the eventual breakout.
Continuation patterns are best traded in the direction of the previous trend. However, entries should only be considered after a valid upside/downside breakout from the pattern with a spike in volume for confirmation. By mastering continuation analysis, traders can consistently profit from trends.
Flag and Pennant Patterns
Flag and pennant patterns are common price continuations that emerge in strong crypto uptrends and downtrends. Their distinct structures provide early signals to traders on where the next breakout will occur. Identifying and capturing these patterns can lead to very profitable trades.
Understanding Flag Patterns
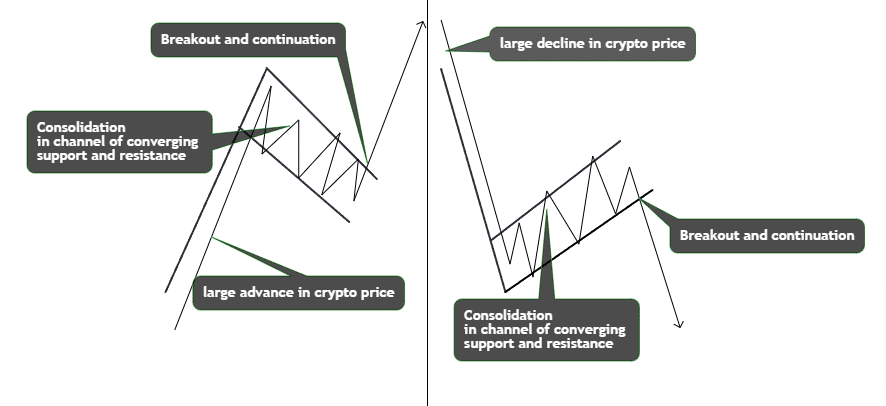
The flag pattern consists of a large advance or decline in crypto price, followed by a channel of converging support and resistance lines angled against the prior move. This overall formation resembles a flag, giving rise to its name. Flag patterns indicate likely price continuation once the upper or lower channel line decisively breaks.

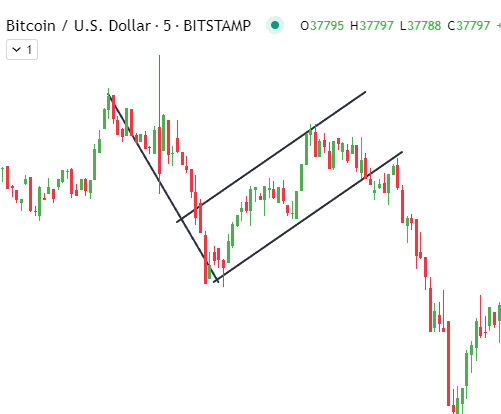
In an uptrend, a bullish flag forms after a sharp price advance. Prices consolidate temporarily in a downward channel below the high, with buying outpacing profit-taking. Once the lower trendline breaks upwards on high volume, prices resume upwards, targeting the prior move’s height.

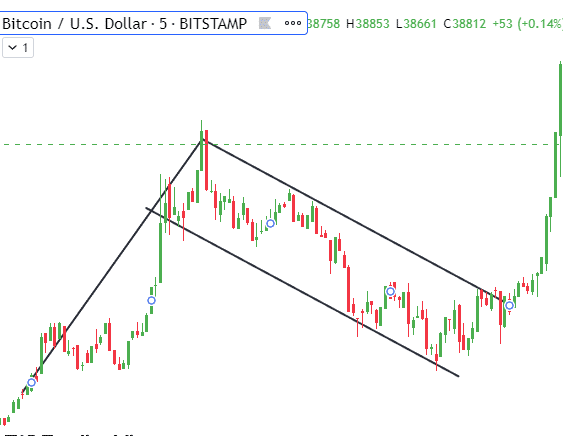
Conversely, a bearish flag follows a strong sell-off down indicating prevailing bearishness. Prices consolidate briefly in an upward channel below the previous low as selling pressure outweighs dip-buying. When the upper trendline breaks downward with volume, the sell-off continues downward to match the initial drop’s height.

Exploring Pennant Patterns
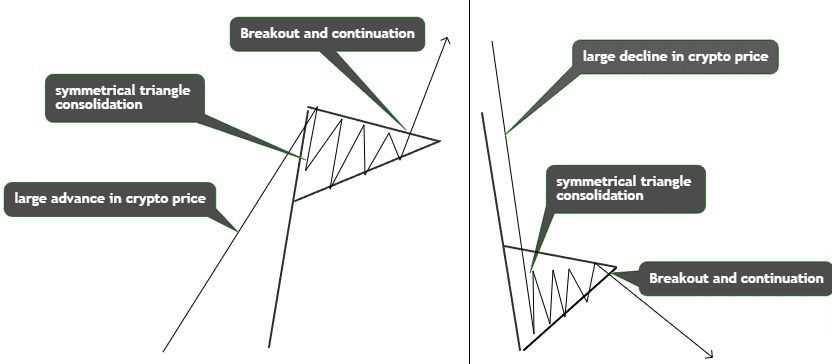
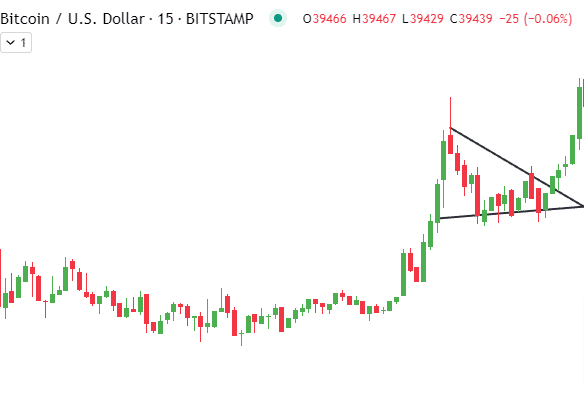
Pennants exhibit similar continuation signals as flags but feature a symmetrical triangle consolidation after sharp price moves. This triangle pattern reflects market indecision before the final breakout signals trend resumption.

A bullish pennant forms after a sharp price spike during an uptrend. A brief symmetrical triangle consolidates the spike as momentum slows. When the upper trendline breaks out upwards on high volume, prices explode upwards targeting the preceding spike’s height.

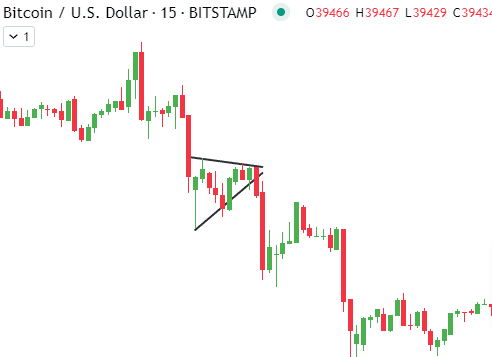
A bearish pennant emerges following a steep sell-off in a downtrend. Prices stabilize briefly in a symmetrical triangle as bulls and bears counterbalance. Once the lower trendline breaks downward with a strong bearish volume, the preceding downspike’s distance becomes the measured target.

Interpreting Breakouts and Targets
For reliable signals, breaks from flag and pennant pattern channels must occur with increased volume for confirmation. Volume affirms that most market participants concur regarding the likely post-breakout price direction. The magnitude of the eventual move depends on the height of the original advance/decline.
Notably, sometimes price breakouts from flags and pennants can occur very rapidly, leaving little time to enter. Having appropriate buy/sell limits on orders beyond the channel is essential to capitalize in time before the wider market reacts. This highlights why early pattern identification is a valuable edge.
Disclaimer: Don’t invest unless you’re prepared to lose all the money you invest. This is a high-risk investment and you should not expect to be protected if something goes wrong. Take 2 mins to learn more.
Symmetrical Triangle Patterns
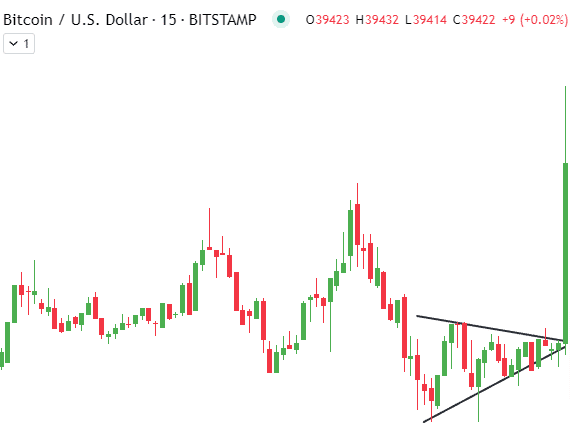
The symmetrical triangle is another common continuation pattern spotted frequently in crypto price charts. True to their name, symmetrical triangles have a distinctive cone-like shape, reflecting equal pressure from both buyers and sellers momentarily.
Symmetrical Triangle Structure
Symmetrical triangles take shape as the crypto market consolidates within converging upper and lower trendlines. As the angle tightens, volatility declines while traders determine directional bias. The upper trendline connects the swing highs, while the lower trendline traces the swing lows, revealing the market’s balanced indecision.
Volume within the symmetrical triangle also diminishes over time as uncertainty prevails. No clear winners emerge yet between bulls and bears during this pattern. The converging trendlines eventually meet to form an apex, representing the triangular pattern’s termination point.
Analyzing Breakouts and Price Targets

The future breakout direction from the triangle proves critical for traders. A high-volume upside break signals the resumption of the prior bull trend, while a bearish downside break indicates more losses. The distance of the widest part of the triangle sets the initial price target projected from the breakout point.
Analyzing volume is vital when trading symmetrical triangles. Aggressive entries should only be taken after a breakout with spikes in volume for added confidence regarding sustainability. Early identification and volume confirmation are essential to capitalizing on symmetrical triangle trade signals.
Your capital is at risk.
Introduction to Reversal Patterns
While continuation patterns signal a temporary pause within larger trends, reversal patterns indicate an actual shift in market sentiment and an incoming trend change. Mastering reversal analysis early is key to profiting from swings.
Identifying Potential Trend Reversals
No trend lasts forever and periodic reversals are inevitable, even in the most persistent uptrends or downtrends. Retracements start gradually initially before accelerating downward or upward. Thus, being able to detect early reversal warnings offers a valuable edge to traders.
Reversal chart patterns include identifiable structures signaling trend exhaustion, like head and shoulders and double and triple tops & bottoms. These crypto trading patterns emerge after directional moves have been stretched to their limits and reflect hesitation, indecision, and waning momentum. Their formations indicate potential market turning points.
Significance of Volume in Reversal Patterns
Cryptocurrency reversal patterns must be confirmed through trading volumes before reliability can be established. Increasing upside volumes affirm growing buying interest and possible upside breakouts. Bearish volumes show the opposite. Using volume metrics to validate or invalidate developing reversal patterns is essential for timing profitable trend change trades.
By recognizing major high-probability reversal patterns early, crypto traders can prepare to exit existing trades and plan contrarian entries well in advance of the crowd. This first-mover advantage enables capturing most of a coming retracement’s profits.
Head and Shoulders Patterns
The head and shoulders pattern is a very reliable top reversal formation, signaling an uptrend’s exhaustion. Learning to recognize and trade this crypto chart pattern early is essential to profiting from impending trend changes.
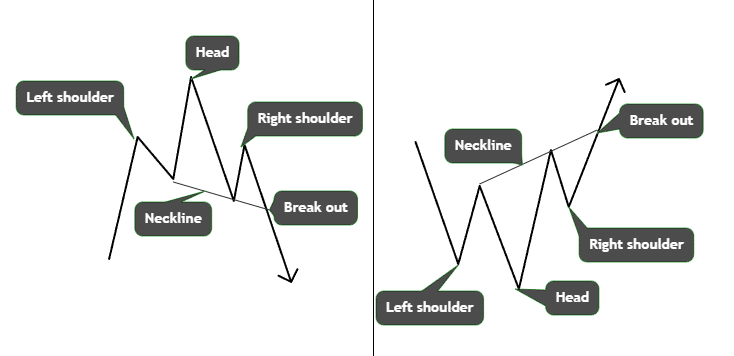
Anatomy of the Head and Shoulders Pattern
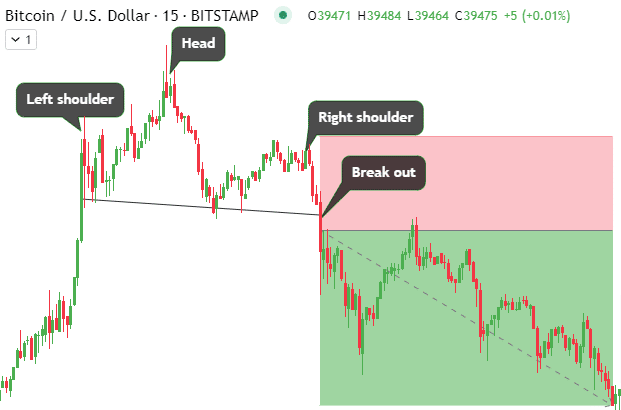
The standard head and shoulders pattern contains three swing highs, with the middle peak being the highest, forming the “head” after an advance. The two on either side form the “shoulders” at lower levels. As the uptrend loses steam, the middle top diverges, marking trend weakness. The lows on either side, called “armpits,” should align to confirm the pattern.

A key hallmark is the “neckline,” which connects the two armpits. The forming head and shoulders pattern indicates potential reversal,l which gets confirmed when prices break the neckline on heavy volume post right shoulder formation.
Applying Neckline Analysis and Targets
The subsequent move’s target equals the distance from the head top to the neckline projected downward from the neckline breakdown point. Traders estimate reversal depth using this method after getting in at the early neckline break stages.

The most reliable entries happen once selling volume spikes as the price closes below the chart pattern’s neckline. Preparing buy-stop sell orders allows capitalizing on accelerated down-moves. Stop losses are placed beyond the right shoulder to contain losses if the pattern fails. Head and shoulders analysis offers a very favorable risk-reward when traded correctly.
Double Top and Double Bottom Patterns
Along with head and shoulders formations, double tops and bottoms are common reversal base patterns. Double tops signal uptrend exhaustion, while double bottoms indicate downtrends peaking. Understanding both allows you to capitalize on trend reversals.
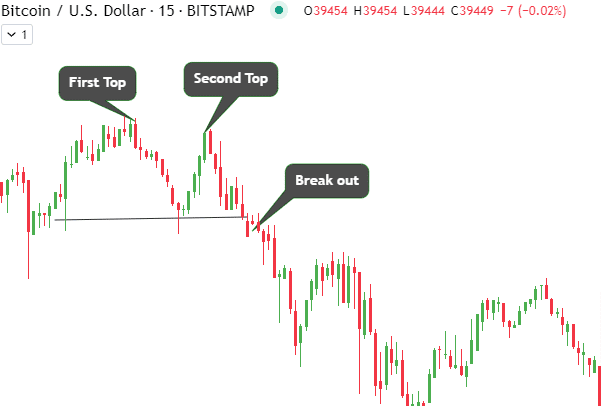
Recognizing Double Top Patterns
The double-top pattern starts forming when a crypto topping after an uptrend pulls back temporarily before revisiting earlier highs. The inability to break past the previous peak despite multiple attempts shows waning upside momentum. Sellers gain control, leading to a trend reversal post-confirmation.

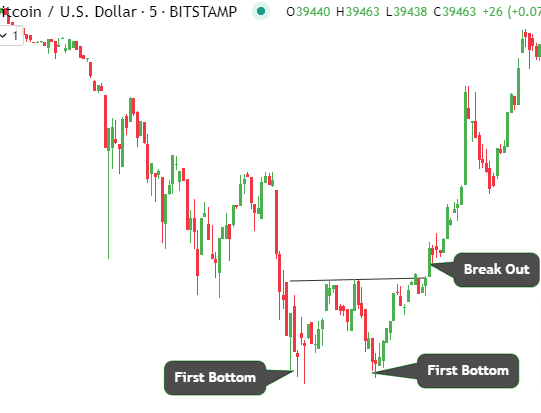
Identifying Double Bottom Patterns
In contrast, double-bottom patterns emerge after prolonged declines when prices make two unsuccessful attempts to breach recent lows amid stabilizing buying pressure. The second bottom indicates demand strengthening and the inability of bears to sustain lower pricing. This leads to an eventual upside break, confirming a trend reversal.

Projection after Confirmation
In both patterns, the zone between two peaks/troughs gets broken decisively, with volumes indicating complete directional change. The initial move’s depth from breakout onset to the opposite pattern end sets the upcoming move’s target. Crypto double tops and bottoms provide very reliable reversal trades when confirmed properly.
Disclaimer: Don’t invest unless you’re prepared to lose all the money you invest. This is a high-risk investment and you should not expect to be protected if something goes wrong. Take 2 mins to learn more.
Incorporating Chart Patterns in Trading Strategies
Having gone through the crypto trading chart patterns overview, let’s talk about how to incorporate them into a strategy. While crypto trading chart patterns seem straightforward, combining other analysis techniques improves strategy accuracy and performance. Relying solely on patterns leads to mediocre results compared to a multi-dimensional approach.
Using Patterns in Conjunction with Indicators
Incorporating leading indicators like RSI, MACD, etc. with pattern analysis creates high-probability setups. Overbought/oversold readings near pattern breakouts indicate whether continuation or reversal-aligned moves are forthcoming. The divergence between price and oscillators also highlights robust signals.
Integrating Patterns into Entry and Exit Points
The basic rules for crypto trading chart patterns center on volume breakouts signaling forthcoming moves. However, pure breakout entries suffer from poor risk-reward profiles and are vulnerable to false breaks. Optimizing entry and exit levels is essential.
Using confirmations from indicators along with other techniques like price action improves pattern reliability significantly. Candle closes, momentum shifts, or volume pickups post initial breaks offer superior entries with lower risks than basic breakout trades. Defining exit rules before trade inception is equally vital for consolidating pattern profits.
Melding together patterns with supplementary indicators and price metrics leads to higher odds and expectancy. Relying solely on pattern breakouts generates mediocre outcomes compared to synergistic, multi-factor strategies. The sum is greater than the individual components.
The Importance of Risk Management
Robust risk management is crucial while trading chart patterns to survive intermittent false breaks or failed formations. Defining stop losses and position sizing rules before entry allows crypto trading patterns to run smoothly.
Setting Stop-Loss Orders with Chart Patterns
Volatility post-breakouts necessitates reasonable stop placement, allowing room for some ebb and flow while restricting loss if moves stall quickly. Stop levels rely on recent swing highs/lows, breakout thresholds, or technical indicators.
Determining Position Sizes Based on Patterns
The reliability of specific continuation or reversal patterns guides appropriate position sizing. High probability setups warrant larger sizes than speculatively volatile formations. The depth of the pattern also indicates potential rewards justifying capital commitment.
By integrating prudent loss limitation and bet sizing tactics, crypto trading chart pattern trades benefit from favorable risk-reward profiles. Reasonable stop distances contain capital at risk while still allowing some adverse price action after entries. Bet sizing also depends on targets projected from the patterns and entry quality. These two pillars shield trading capital, permitting winners to multiply.
Disclaimer: Don’t invest unless you’re prepared to lose all the money you invest. This is a high-risk investment and you should not expect to be protected if something goes wrong. Take 2 mins to learn more.
Avoiding Common Pitfalls
While using crypto trading patterns can be highly rewarding, several common mistakes plague beginners. Being cognizant of these pitfalls allows you to avoid them.
- Overtrading Based on Patterns: Overtrading by taking every potential pattern signal and risking too much capital on speculative formations with lower probability must be prevented.
- Being Cautious of False Signals: Additionally, false pattern breakouts and failed formations are intermittent risks. Not waiting for confirmation candles or volume can lead to acting prematurely on false signals, leading to losses.
Backtesting and Learning from Experience
In this section of our crypto trading chart patterns overview, let’s talk about continuously honing strategy rules before applying them in live markets.
- Testing Chart Patterns on Historical Data: Backtesting chart pattern strategies on historical data is invaluable for sharpening skills and boosting readiness based on evidence. Quantifying performance metrics like risk-reward ratios, win percentages, and expectancy over hundreds of trades measures an approach’s edge.
- Continuously Improving Pattern Recognition Skills: Consistent testing also grows one’s pattern recognition capabilities over time. Use a demo trading app to test your new knowledge of chart patterns. Reviewing both winning and losing pattern trades to identify reasons behind outcomes is critical for incremental progress.
Trade with crypto trading chart patterns—eToro Complete Guide
Are you ready to put your chart pattern knowledge into action? We recommend starting with a demo account with simulated real-life trading conditions. That offers the best opportunity to sharpen your skillsinn crypto trading patterns.
eToro provides a virtual trading account with $100,000. It is excellent for beginners. Even so, expert traders will appreciate its advanced features.

Note: Only cryptocurrencies eToro customers in the United States will be able to trade on the platform will be Bitcoin, Bitcoin Cash, and Ethereum.
Follow this step-by-step guide to open an account with eToro and start trading cryptocurrencies:
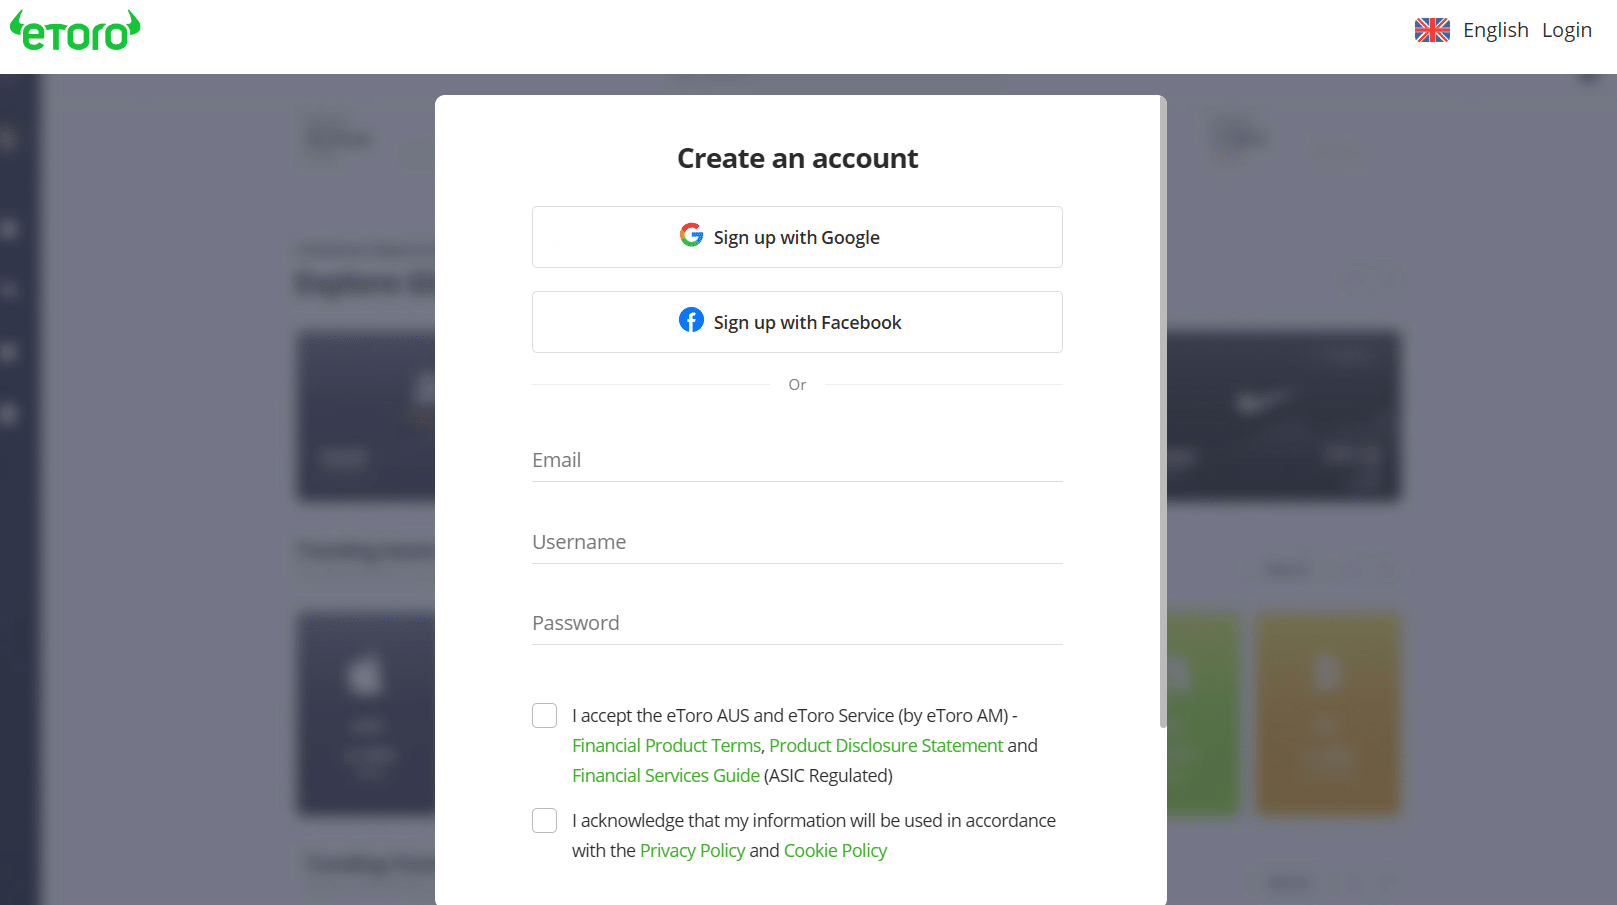
Step 1: Go to the eToro homepageVisit the eToro “Join Now” page and click on “Create an account.” Provide your information, like a username or e-mail address, or register with social accounts like Facebook and Google.
Review the terms and conditions, then proceed if you are okay with them.
Step 2: Verify your emaileToro will send a verification email. While there is no fixed time for how long the mail remains valid, we recommend verifying your email quickly. Enter the verification code on the registration page to proceed.
Step 3: Deposit into your accounteToro supports credit card payments. Once ready, go to the deposit page, input the amount you want to deposit into your account and enter your card details.
Provide authorization for the transaction. Conversely, you can switch to the virtual account.
Step 4: Start tradingGo to the trading dashboard and find the crypto asset you want to trade. Click it to view its price movements. Analyze the chart and start trading.
Crypto Trading Chart Patterns Overview- Conclusion
Crypto chart patterns capture valuable signals from historical price data to time entries and exits. This crypto trading chart pattern overview provides all the insight you need to get started with chart patterns. Mastering continuation and reversal patterns accelerates profitable trade discovery.
Interested in using crypto trading patterns? Open a risk-free demo account on eToro to try pattern strategies.
Disclaimer: Don’t invest unless you’re prepared to lose all the money you invest. This is a high-risk investment and you should not expect to be protected if something goes wrong. Take 2 mins to learn more.
References
https://corporatefinanceinstitute.com/resources/wealth-management/risk-tolerance/
https://www.bbc.com/news/technology-61796155
https://www.forbes.com/sites/nicolelapin/2021/12/23/explaining-cryptos-volatility/?sh=382a19c47b54
FAQs
How do you read crypto chart patterns?
Reading crypto chart patterns relies on identifying specific structures that form within historical price movements over time. Key aspects involve trend direction ahead of the pattern, levels marking formations, volume changes, projected targets, and confirmation breakouts. Analyzing all these metrics builds conviction about the pattern’s message.
What patterns to look for in crypto?
The most reliable patterns in crypto trading include flags, symmetrical triangles, and head & shoulders for capturing continuations and reversals early. Volume-confirmed breakdowns or breakouts signal high probability moves ahead. Additionally, channels, wedges, and expanding triangles also provide opportune trade signals.
What is the most accurate pattern in crypto?
Among reliable patterns, the head & shoulders reversal stands out with the highest risk-reward ratio when traded correctly. Precise points marking the left shoulder, head peak, right shoulder, and neckline provide defined entry, stop loss, and 2:1 to 3:1 target projections.
What is the best crypto indicator chart?
For crypto charts, volume and relative strength indicators provide the best additional confirmation about trend strength and divergences. Price action metrics like candle patterns and momentum also serve as excellent supplements to pattern analysis for even higher accuracy setups.

Jeremiah Awogboro

Jeremiah Awogboro
View all posts by Jeremiah AwogboroJeremiah Awogboro is an experienced content writer with over 8 years of experience. He has a qualified MBChB degree and a keen interest in the stock market and the finance industry. His background in the industry has provided him with valuable experience in this field. Awogboro is dedicated to assisting and reaching out to as many people as possible through his writing. In his spare time, he enjoys music, football, traveling, and reading.

eToro: Overall Best Stock App with 0% Commission
VISIT ETOROYour capital is at risk. Other fees apply. For more information, visit etoro.com/trading/fees.stockapps.com has no intention that any of the information it provides is used for illegal purposes. It is your own personal responsibility to make sure that all age and other relevant requirements are adhered to before registering with a trading, investing or betting operator. Contracts for Difference (“CFDs”) are leveraged products and carry a significant risk of loss to your capital. Please ensure you fully understand the risks and seek independent advice.By continuing to use this website you agree to our terms and conditions and privacy policy.
Trading is risky and you might lose part, or all your capital invested. Information provided is for informational and educational purposes only and does not represent any type of financial advice and/or investment recommendation.
Crypto promotions on this site do not comply with the UK Financial Promotions Regime and is not intended for UK consumers.
© stockapps.com All Rights Reserved 2026
We use cookies to ensure that we give you the best experience on our website. If you continue to use this site we will assume that you are happy with it.Scroll Up