Learn How to Read Crypto Charts And Use Technical Indicators

Reading cryptocurrency charts is crucial for traders as it allows them to find the best opportunities in the market. Reading charts, also known as technical analysis, helps investors identify market trends and predict the future price movements of cryptocurrencies.
In this article, we are going to look at how to read crypto charts and identify opportunities in the cryptocurrency market.
-
-
What are Crypto Charts?
Reading a crypto chart is an essential skill when trading cryptocurrencies. Charts showcase the price history of a crypto asset. Reading the charts enables you to assess price movements and recognize patterns.
Crypto charts are graphical representations of the historical price, volume, and time intervals of a crypto asset. The chart forms patterns based on the past price movement of a cryptocurrency and allows traders to spot trading opportunities.
The Importance of Using Charts for Analyzing Cryptocurrency Prices
When carrying out technical analysis, the primary goal is to analyze the past performance of a cryptocurrency and predict what may happen in the future. As a trader, it is your job to evaluate the price fluctuation, volume data, price levels, and trading sessions to enable you to find entry and exit points in a trade.
Without reading charts, a trader is simply gambling as they can’t find the best entry and exit points in the market.
Your capital is at risk.
Types of Crypto Charts
Before we learn how to read crypto charts, we first have to know the various types of charts. There are three types of charts: line charts, bar charts, and candlestick charts. Let us look at the various types of crypto charts.
Overview of Different Types of Charts (e.g., Line Charts, Candlestick Charts, Bar Charts)
- Line Charts
A line chart is a popular type of chart that connects the closing prices of the timeframe a trader is viewing. This implies that when viewing a daily chart, the line connects the closing price of each trading day.
The line chart is the most basic type of chart used by cryptocurrency traders. However, line charts do not offer much information compared to the other chart types.
- Bar Charts
This type of chart shows a bar for each period you are viewing. This means that when you are viewing a 4-hour chart, each vertical bar represents 4 hours worth of trading.
The bar chart offers more information to traders than the line chart. The bar chart shows information such as the open, high, low and close (OHLC) values of the bar.
The bullish green bars indicate that the closing price is higher than the starting price. The red bars are the bearish bars (the starting price is higher than the closing price). Bar charts help traders identify who is in control of the market between the sellers and buyers.
- Candlestick Charts
This is perhaps the most popular type of chart. Japanese traders first used it in the 18th century, and have gained wide adoption. Similar to the bar charts, candlesticks have the OHLC (Open, High, Low, and Close) bars. However, unlike the bar charts, candlesticks have a box between the open and close values, known as the body of the candlestick. Candlestick charts are very popular due to the information they provide to traders.

Choosing the right chart type for your analysis
Deciding on the chart type to use for technical analysis solely depends on the trader. However, the candlestick chart is very popular among the three major chart types. This is because the candlestick chart provides more information to traders.
With the candlestick charts, you will get information such as the Open, High, Low, and Close values. This information will help you determine if buyers or sellers are in control. Furthermore, the body of the candlestick also gives you further information about the trading volume and other data regarding a crypto trading pair. Some of the best free stock apps also support cryptocurrency chart analysis.
Your capital is at risk.
Understanding Price Axes
To learn how to read crypto charts for day trading, you must understand price axes. They provide more information about a chart and help make better trading decisions.
Explanation of the Vertical (Price) Axis on Crypto Charts
Cryptocurrency trading charts have ‘time’ along the horizontal x-axis while the ‘price’ stays on the vertical y-axis. This implies that traders can view historical prices as they move to the left of the chart.
The dates and times displayed on a chart will vary depending on how the trader zooms in or out of the chart. The more the trader zooms out, the more historical price action they will see.
If, from the left side of the chart to the right side, the value of a crypto asset has decreased, we can conclude that over that period of time, the market is in a downtrend or the sellers are in control.
However, if from the left side of the chart to the right, the asset’s value has increased, we can conclude that over that period, the market is in an uptrend or that the buyers are in control.
How to Interpret Price Movements and Trends
In the cryptocurrency market, a trend is the general direction in which the price of an asset moves. Usually, trends can be bullish (upwards), bearish (downward), or ranging (flat).
When interpreting a market trend, the timeframe you view the chart matters greatly. There is no specific timeline for a direction to be viewed as a trend. However, the longer the direction is sustained, the more it is considered a trend. Let us look at the various types of trends and how to interpret them.
- Uptrend
An uptrend, also known as a bullish trend, is a price movement in an upward direction. For a trend to be considered bullish, the asset should have formed higher highs and higher lows multiple times in a specific timeframe.
The bullish trend is clearly visible on cryptocurrency charts as it is a curve that reaches new highs at specific time intervals. Upward price direction implies an increase in the price of a crypto asset over a certain period. Usually, upward trends are formed in bullish markets.
- Downtrend
This is a bearish trend that shows the movement of a crypto asset to a lower price than its previous position. For a bearish trend to be confirmed, we will need to have lower highs and lower lows on the chart.
In a bearish trend, the sellers generally control the market. Downward trends are usually formed during a bear market. Similar to the bullish trends, a bearish trend can be identified using trend lines and other indicators like the moving averages.
- Ranging trend
This is also known as the flat or sideways trend. This means the market is in a neutral trend, with no visible group in control. In a ranging market, the price of a crypto asset moves up and down in a certain price range.
Timeframes and Periods
We cannot properly learn how to read crypto charts if we don’t understand the various timeframes and periods. Numerous timeframes are available on a chart, depending on the trading tool you use for analysis.
Explanation of Different Timeframes (e.g., 1-Minute, 1-Hour, Daily) on Crypto Charts
Cryptocurrency technical analysis is broken down into intervals known as timeframes. The timeframes vary from seconds to minutes, hours, days, weeks and months.
For traders, the most common timeframes used to determine market trends are the 15-minute, hourly, 4-hour, 6-hour, and daily charts. However, some traders also use higher timeframes, like weekly, to confirm trends and their entry and exit points.
The timeframe a trader chooses depends on their overall trading style. For instance, the monthly, weekly and daily crypto charts suit traders who hold positions for long periods of time (swing or positional traders).
Meanwhile, the four-hour, hourly and thirty-minute charts are mostly used by intraday traders or those holding positions for a few hours or days.
Finally, we have scalpers and day traders. These traders usually use the 15-minute, five-minute and one-minute charts. Depending on your trading tool, you can easily toggle between these different timeframes. You can also use some of the best day trading apps to make it easier for you.

Selecting the Appropriate Timeframe for Your Analysis
Traders who are still learning how to read crypto charts for day trading often wonder about the best chart timeframe to use. However, the best timeframe to use for your analysis depends on your personality as a trader. It is also a matter of personal preference.
However, there are some best practices to look into when using multiple timeframe analysis. If you are a day trader or scalper, your focus could be on the lower timeframe between the 30-minute to 1-minute timeframe.
Swingers or positional traders hold positions for much longer and use the higher timeframes, such as the monthly, weekly and daily crypto charts.
Your capital is at risk.
Identifying Trends
Trends in the cryptocurrency market are based on historical prices. However, the ultimate purpose of trend identification is to forecast future trends. Trends allow traders to identify market or individual crypto asset movement along with volumes.
With trends, it becomes easier for traders to plan entry and exit points accordingly.
Recognizing bullish (uptrend) and bearish (downtrend) trends
There are two major trends in the cryptocurrency market: bullish and bearish. Let us look at them and how you can recognize them in a chart.
- Bullish trend
This is an upward trend of a crypto asset, and it usually appears when the prices of the asset make higher highs and higher lows. In bullish trends, there is an ascending movement in the price of an asset. Furthermore, the prices of the asset will have consecutive higher peaks and troughs.
- Bearish trend
Bearish trends, on the other hand, are downward trends in the price of a crypto asset. The bearish trends are formed when the price of a crypto asset makes lower highs and lower lows. In a bearish trend, there is a descending movement in the price of the asset. Furthermore, the price of the asset will have consecutive lower peaks and troughs.

- Horizontal trend
This is also known as the ranging or flat trend. This trend occurs when the price of a crypto asset moves in a horizontal range.
Using Trendlines and Patterns to Confirm Trends
Trendlines and crypto chart patterns provide traders with valuable insights into market psychology and behavior. As a trader, you can interpret trendlines and patterns to determine the trend direction, strength, and possible reversal.
The slope and direction of a trendline or pattern indicate whether the trend is bearish, bullish, or flat. Furthermore, the steepness and length of a trendline or pattern show how strong or weak the trend is.
A break in the structure of the trendline could also indicate a trend reversal. However, it is important to look for other signs of confirmation using indicators or patterns before deciding the direction of a pattern.
As a trader, trendlines and patterns are flexible tools that may vary depending on the timeframe you use and how you draw them. Using multiple timeframes can help you draw and confirm trendlines and patterns. Furthermore, using multiple points of contact can help you draw a more reliable trend line or pattern.
Finally, you can use other tools and methods like indicators and Fibonacci retracements to complement and confirm trendlines. Other tools you can use to confirm trend direction and strength include moving averages and oscillators.
What are Candlestick Charts?
If you wish to learn how to read crypto candlestick charts, you must first know what candlestick charts are. Crypto candlestick charts are popular because they offer more information compared to the other chart types.
Introduction to Candlestick Charts and Their Components (e.g., Body, Wick, Shadow)
Candlestick charts are popular within the crypto space and beyond. They show time across the horizontal axes and price data on the vertical axes.
Similar to bar charts, candlestick charts have the OHLC information. Each candlestick chart contains the open, high, low, and close price of a cryptocurrency asset.
A candlestick essentially comprises a body and wicks. The body of each candlestick represents the opening and closing prices, while the top wick indicates how high the price of a crypto asset was during a specific timeframe. Meanwhile, the bottom wick represents how low it got.
Furthermore, candlestick charts usually have two different colors: green and red. Green candles are bullish candles and indicate a price increase over a certain period of time. The red candles are bearish and show the price decline of a crypto asset over a certain period.
The structure of a candlestick can offer traders a lot of information. Traders use candlestick patterns to identify potential trend reversals and continuation.
History and Significance of Candlestick Patterns in Technical Analysis
Candlestick charts are technical tools that insert data for multiple timeframes into single price bars. The information contained with candlestick charts is far more useful compared to what you have with the traditional OHLC bars.
Candlesticks build price patterns and trends that traders can use to predict the price direction of a crypto asset. They have been in use since the 18th century after Japanese rice traders invented them.
Common Candlestick Patterns
To understand how to read crypto candlestick charts, you must know the common candlestick patterns. These patterns give you information that can help you predict a crypto asset’s price movement.

Explanation of Key Candlestick Patterns (e.g., Doji, Hammer, Engulfing, Shooting Star)
Here are some of the key candlestick patterns:
- Doji and Spinning Top
A Doji is a candlestick pattern where the open and close are almost identical. A spinning top is similar to the Doji but has a smaller body.
The two patterns suggest indecision in the market, with the buyers and sellers at a standstill. Traders know that the indecision will eventually evaporate, and a new price direction will be formed.
- Bullish/Bearish Engulfing Lines
The bullish and bearish engulfing lines are strong indicators of a directional change. The bearish engulfing pattern emerges after an uptrend and indicates that a bearish reversal is at play. The bullish engulfing appears at the end of a downtrend and indicates that a bullish reversal is at play.
In both cases, the second body’s candle engulfs the previous body in the opposite direction. This suggests that the trend is stalling, and a reversal is about to commence.
- Hammer
A hammer candlestick indicates that a downtrend is ending. In a hammer, the sellers made an attempt to push the asset’s price lower but were rebuffed, and the price erased most of the losses in the previous candle. When a hammer appears, it shows that buyers are coming into the market with strength.
- Hanging Man
This candlestick pattern suggests a potential reversal lower and is the opposite of the bullish hammer candlestick. This candlestick pattern appears after consecutive increases in the price of an asset. The emergence of the hanging man candlestick shows that sellers are emerging, and the asset’s price could drop lower in the short term.
- Abandoned Baby Top/Bottom
This is also called an island reversal. This chart pattern suggests a major reversal in the prior directional movement. The abandoned baby top candlestick pattern forms after an upward movement, while the abandoned baby bottom forms after a downtrend.
Interpreting Candlestick Patterns for Trading Signals
Interpreting candlestick patterns is key to trading cryptocurrencies. The upper and lower shadows on candlesticks provide valuable data about the trading session.
Upper shadows indicate the session high, while the lower shadows represent the session lower.
Candlesticks with short shadows suggest that most of the trading action was restricted near the open and close. Meanwhile, candlesticks with long shadows indicate that prices extended well beyond the open and close.
Candlesticks with a long upper shadow and a short lower shadow suggest that buyers were in control during the session. However, sellers ultimately forced prices down from the highs.
On the other hand, candlesticks with long lower shadows and short upper shadows suggest that sellers dominated the trading session and drove prices lower. However, buyers later took control and bid prices higher by the end of the session
Understanding candlesticks and interpreting them helps traders gain better entry and exit points into a trade. As an investor, you can also keep an eye on the best DeFi apps to help you expand your base within the crypto ecosystem.
Introduction to Technical Indicators
Technical indicators are tools that traders use to see the possible price movement of an asset in a more predictive way. With technical indicators, crypto traders can see the current position of price based on certain metrics.
However, to attain a reliable outcome from technical analysis, traders must understand the various essential indicators.

Explanation of Technical Indicators and their Tole in Crypto Chart Analysis
Technical indicators are pattern-based signals generated by the price, volume, and open interest of a cryptocurrency. Traders use technical indicators to carry out technical analysis and determine the best positions to enter and exit trades.
Traders use technical indicators to predict future price movements by analyzing historical data. Technical indicators play a crucial role in crypto trading, providing traders with valuable insights into market trends and price movements.
The indicators use mathematical calculations and statistical analysis to help you identify patterns, trends, and potential price movements. By leveraging technical indicators, you can make better decisions about when to enter or exit a trade. Thus, helping you maximize profits and minimize losses.
There are hundreds of technical indicators currently available to traders. You can choose the indicators that work best for you. Furthermore, you can also combine two or more technical indicators to help you determine chart patterns and generate trade ideas. The best paper trading apps can also be useful in helping you analyze crypto charts.
Different Categories of Technical Indicators (e.g., Trend-Following, Oscillators, Volume)
There are various categories of technical indicators. Here are the most popular ones:
- Trend-Following Indicators
This group of indicators help traders trade crypto assets that are trending up or trending down. With trend-following indicators, you can point out the direction of a trend and determine if a trend actually exists. These indicators also help measure the direction and strength of a trend.
Examples of trend-following indicators include the moving averages, MACD, and Parabolic SAR.
- Momentum Indicators
Indicators in this group help traders identify the speed of price movements. They achieve this by comparing prices over time. Momentum indicators are also useful for analyzing trading volume.
Examples of momentum indicators include Stochastic, CCI, and RSI.
- Volatility Indicators
With volatility indicators, you can measure the rate of price movements regardless of the asset’s direction. Volatility indicators usually work with changes in the highest and lowest historical prices.
This group of indicators provides important information about the range of buying and selling that takes place in a crypto trading pair. Examples of volatility indicators include Bollinger Bands, Standard Deviation, and Average True Range (a type of Supertrend indicator).
- Volume Indicators
These indicators measure the strength of a trend or confirm a trading direction using the average volume of a trading pair. The strongest trends often take place while volume rises.
Some examples of volume indicators include Chaikin Money Flow (CMF), On Balance Volume (OBV), and Volume Oscillator (VO).
Your capital is at risk.
Popular Technical Indicators
Although we have numerous technical indicators available to traders, some indicators are very popular, thanks to the advantages they have over others. Learning how to read crypto charts also involves knowing more about the popular technical indicators.
Overview of Widely Used Technical Indicators (e.g., Moving Averages, Relative Strength Index, MACD)
When carrying out technical analysis, you cannot ignore technical indicators. Here are some of the most popular technical indicators for cryptocurrency traders.
- Relative Strength Index (RSI)
The RSI is a momentum indicator that showcases results on a scale of 1-100. This indicator shows the overbought and oversold conditions of a cryptocurrency asset. An RSI below 30 shows that a cryptocurrency is bearish and is oversold. When the RSI is above 70, it means that the crypto asset is overbought and is bullish.
As a momentum indicator, the price of a crypto asset can stay in overbought or oversold regions for a long period. Thus, RSI is an efficient indicator for providing long-term market trends.
- Moving Average (MA)
This is another popular indicator, and it shows the average price of a crypto trading asset for a specific timeframe. A daily Moving Average of 50 shows the average price of the last 50 days’ price movements. With MA, the idea is to observe the price behavior of a crypto asset and anticipate its future movement.
The simple moving average (SMA) is more efficient when carrying out long-term analysis, while the exponential moving average (EMA) is better for short-term price analysis.
- MACD
Moving average convergence divergence (MACD) is widely used by cryptocurrency traders. This indicator highlights the connection between two crucial moving averages.
A MACD histogram above zero suggests that the market is bullish. However, if the reading is below the signal line, it indicates a bearish movement. Traders use MACD to determine a crypto asset’s future price direction by observing the histogram’s location.
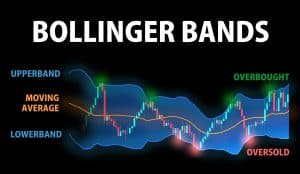
- Bollinger Bands
This technical indicator is also popular and was developed in the 1980s by John Bollinger. The indicator grants traders exceptional insights into the relationship between the price and volatility of an asset.

Furthermore, traders use Bollinger Bands to identify the overbought and oversold levels of a crypto asset. This helps traders to follow trends and find breakouts in the market.
- Fibonacci
Fibonacci retracement is a trading indicator that helps traders identify corrections and extensions when analyzing a crypto asset. The indicator helps predict how long a price may go before undergoing a correction.
This tool uses significant values such as 61.8% or 261.8% to indicate potential take-profit or reversal points.
How to Apply and Interpret Technical Indicators on Crypto Charts
Interpreting indicators successfully on crypto charts means that you already know how to read crypto charts. Technical indicators would help you identify potential trend reversals and also help you confirm them.
Indicators would also help you determine other key information, such as the support and resistance levels. With access to such information, you can gain better exit and entry points when trading cryptocurrencies.
As stated above, there are hundreds of technical indicators available to cryptocurrency traders. The decision on the technical indicators to use on a crypto chart depends on the trader and their trading style. If you are an investor, you can also keep an eye on the best crypto presales to boost your exposure to the market.
How to Read Crypto Charts – eToro Tutorial

In this article, you learned how to read crypto charts. However, carrying out your analysis is not enough. You need to trade on regulated and reputable trading platforms to ensure the safety of your funds. This is where eToro comes in. eToro is one of the most reputable trading platforms in the world and is also regulated. Here are the simple steps to signing up on eToro:
Step 1: Visit eToro “Join Now” page
Step 2: Choose a username, enter your email address, and set a password.
Step 3: Read the Terms and Conditions, Privacy Policy, and Cookie Policy, and tick the boxes.
Step 4: Click on the ‘Create Account’ button.
Step 5: Check your email inbox and verify your email address.
How to Read Crypto Charts – Conclusion
Learning how to read crypto charts is an important skill if you wish to be a successful cryptocurrency trader. This article covered the basics of cryptocurrency charts, the types and how you can read them.
There are various technical indicators available to traders. Your technical indicators should reflect your trading style and whether you are a long-term or short-term trader. When you understand technical analysis, there is no best time to trade cryptocurrencies.
Finally, ensure you trade with regulated platforms like eToro to avoid falling victim to scam trading platforms.
Your capital is at risk.
FAQs
How do you read crypto charts for beginners?
Reading crypto charts as a beginner involves understanding candlesticks and their patterns. You also need to understand market trends as that would help you determine the next price direction of a crypto asset.
How do you read a crypto trading chart?
You read a crypto trading chart by carrying out technical analysis using various indicators. The indicators will help you determine if a crypto asset is bullish or bearish and its likely price direction.
Is it possible to read crypto charts?
Yes, it is possible to read crypto charts. Cryptocurrency traders read crypto charts before longing or shorting an asset. However, you need to understand the basics of candlesticks and technical indicators before you can read a crypto chart
How do you know which coin will go up?
A combination of technical and fundamental analysis will help you determine if a coin will go up or down. Reading a crypto chart is crucial to helping you determine if the price of a crypto asset will go up.

Hassan Maishera

Hassan Maishera
View all posts by Hassan MaisheraHassan is a Nigeria-based financial content creator that has invested in many different blockchain projects, including Bitcoin, Ether, Shiba Inu, Cardano, VeChain and Solana. He currently works as a financial markets and cryptocurrency writer and has contributed to a large number of the leading FX, stock and cryptocurrency blogs in the world, including Coinjournal, Cryptowisser, Decred Magazine, FXempire, and Blokt.

eToro: Overall Best Stock App with 0% Commission
VISIT ETOROYour capital is at risk. Other fees apply. For more information, visit etoro.com/trading/fees.stockapps.com has no intention that any of the information it provides is used for illegal purposes. It is your own personal responsibility to make sure that all age and other relevant requirements are adhered to before registering with a trading, investing or betting operator. Contracts for Difference (“CFDs”) are leveraged products and carry a significant risk of loss to your capital. Please ensure you fully understand the risks and seek independent advice.By continuing to use this website you agree to our terms and conditions and privacy policy.
Trading is risky and you might lose part, or all your capital invested. Information provided is for informational and educational purposes only and does not represent any type of financial advice and/or investment recommendation.
Crypto promotions on this site do not comply with the UK Financial Promotions Regime and is not intended for UK consumers.
© stockapps.com All Rights Reserved 2026